Enterprise firewall Market
By Type (Conventional firewall, Next generation firewall (NGFW) and Application firewall), By Deployment (On-Premise and Cloud), By OrganiSation (End Point, Network, Cloud, Application and Others),By Industry Verticals (Government and Public Utilities, Telecommunication, Healthcare, BFSI, Manufacturing, Retail, Education, Entertainment, Media and others), By Region(North America, Europe, APAC and Rest of the World)
- Report ID : MD1099 |
- Pages : 197 |
- Tables : 87 |
- Formats :


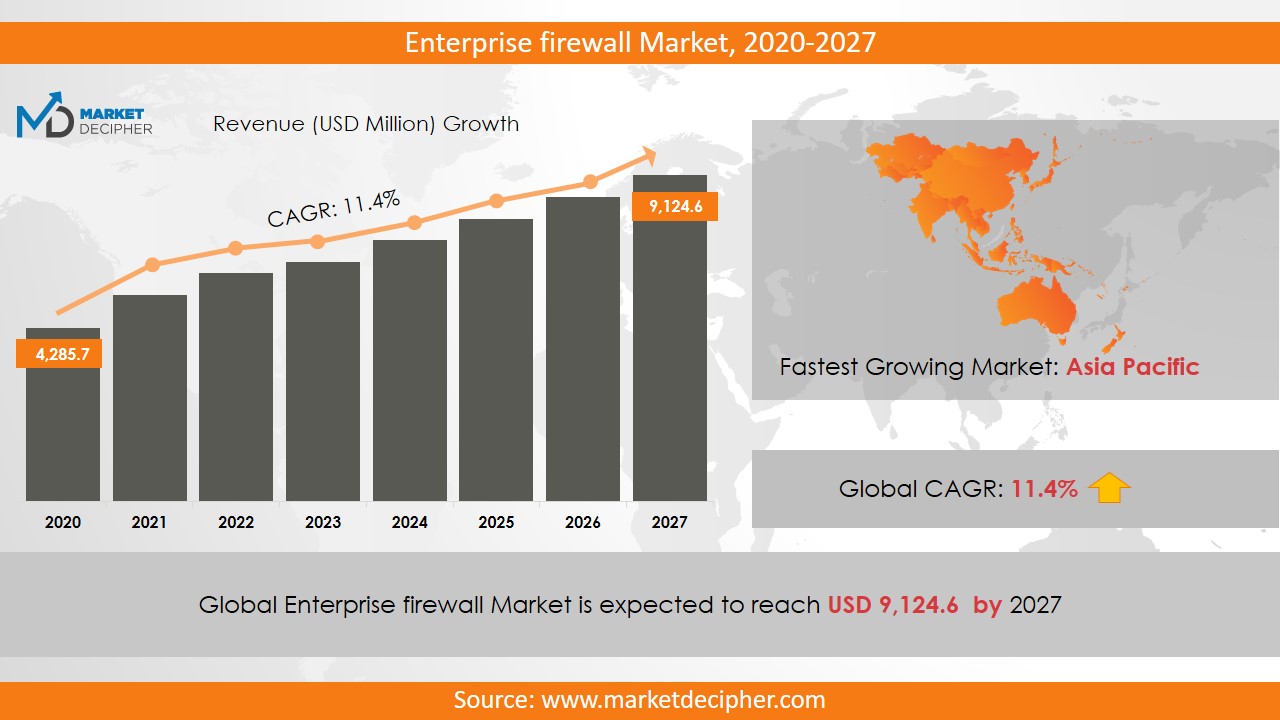
The Enterprise firewall market revenue shall reach a value of $12.89 Million in 2026, growing with a CAGR of 9.8% during the forecast period of 2018 to 2026.
A firewall refers to a network security system that governs incoming and outgoing network traffic according to predefined rules. It acts as a barrier between reliable and unreliable networks and filters network traffic based on the predefined firewall policy. Enterprise firewalls are used for a set of devices that only provide access to specific networks. The growing use of the Internet and Internet-based devices has increased the possibilities of valuable assets and confidential data of being attacked by the attackers. The adoption of cloud computing among various organizations has increased storing and securing the data as it is easy to operate which is making the cloud application more vulnerable to threats and thereby increasing the market growth of the enterprise firewall.
Enterprise firewall filters all the outbound and inbound trafficking of networks. Further, it protects the network by any kind of malicious code and worms. Also, the use of cloud computing is increasing in industries. As per the recent enterprise firewall market report, could based enterprise firewall services revenue increased by 60% in 2015. In 2018, many universities adopted Enterprise firewalls owing to the nature of the information that requires to collaborate. According to the agreement with the Office of Information Security, Penn State has been shifting towards the next-generation firewall platform.
REGIONAL ANALYSIS
The North America region is estimated to account for $442.2 million in 2018. The strict government rules and the presence of a large number of small and medium-sized enterprises are responsible for the market growth in this region. Further, the Asia Pacific region is expected to account for the highest CAGR of 34.2% over the forecast period due to the strict government rules and a large number of investors in the region. Moreover, developing nations such as India, Australia, and China are driving the enterprise firewall market share considerably.
SEGMENT ANALYSIS
In terms of type, the market has been segmented as a conventional firewall, Next generation firewall (NGFW) and Application Firewall. Based on deployment, the market has been segmented as cloud and on-premise. Based on organization, the market has been segmented as End Point, Network, Cloud, Application, and Others. The Cloud application segment is anticipated to augment the market shares significantly over the forecast period.
Major end-user industries are small, medium and large enterprises. The small and medium based industries are adopting enterprise firewalls because of their low cost and contribute significantly to the market growth. Major industry verticals of enterprise firewalls are government and public utilities, telecommunication, healthcare, BFSI, manufacturing, retail, education, entertainment, media, and others. Based on regions, the market has been bifurcated as Asia-Pacific, North America, Europe Middle East and Africa, and Latin America.
INDUSTRY PLAYER ANALYSIS
Major industry players have been analyzed with coverage on their operating areas, revenues, and other strategic aspects. These industry players include Juniper Networks, Cisco Systems, Dell SonicWall, WatchGuard, Fortinet, Technologies, Palo Alto Networks, McAfee, AlgoSec, Imperva, and Check Point. Many industry players adopt new strategies to expand the enterprise firewall business size.
COVERAGE HIGHLIGHTS
• Revenue Estimation and Forecast (2018 – 2026)
• Sales Estimation and Forecast (2018 – 2026)
• Breakdown of Revenue by Segments (2018 – 2026)
• Breakdown of Sales by Segments (2018 – 2026)
• Gross Margin and Profitability Analysis of Companies
• Business Trend and Expansion Analysis
• Regional Analysis and Data Breakdown
SEGMENTAL ANALYSIS
By Type Outlook ($Revenue and Unit Sales, 2018-2026)
· conventional firewall
· Next-generation firewall (NGFW)
· Application firewall
By Deployment Outlook ($Revenue and Unit Sales, 2018-2026)
• Cloud
• On-premise
By Organization size Outlook ($Revenue and Unit Sales, 2018-2026)
· Small enterprises
· Medium enterprises
· Large enterprises
By Organization Outlook ($Revenue and Unit Sales, 2018-2026)
· Government and public utilities
· Telecommunication
· Healthcare
· BFSI
· Manufacturing
· Retail
· Education
· Entertainment
· Media
· Others
By Regional Outlook ($Revenue and Unit Sales, 2018-2026)
• North America
• Canada
• U.S
• Mexico
• Europe
• Germany
• U.K
• France
• Netherlands
• Austria
• Rest of Europe
• Asia-Pacific
• China
• India
• Japan
• South Korea
• Australia
• Rest of Asia Pacific
• The Middle East and Africa
• Saudi Arabia
• United Arab Emirates
• Rest of Middle East
• Africa
• South America
• Brazil
• Argentina
• Rest of South America
INDUSTRY PLAYERS ANALYSIS:
· Juniper Networks
· Cisco Systems
· Dell SonicWall
· WatchGuard
· Fortinet
· Technologies
· Palo Alto Networks
· McAfee
· AlgoSec
· Imperva
· Check Point
CHAPTER 1. INTRODUCTION
1.1. RESEARCH METHODOLOGY
1.1.1. Data Collection
1.1.2. Data Modeling
1.1.3. Historical Revenue and Sales Estimation
1.1.4. Data Triangulation
1.2. RESEARCH PROCESS
1.2.1. Primary Research
1.2.2. Secondary Research
1.2.3. Survey Data
1.2.4. Validation by In-House Expert
1.3. ENTERPRISE FIREWALL MARKET OVERVIEW
1.3.1. Research Scope and Market Definition
1.3.2. Executive Summary
CHAPTER 2. GLOBAL ENTERPRISE FIREWALL MARKET DEMAND SIDE ANALYSIS
2.1. ENTERPRISE FIREWALL MARKET CONSUMPTION VOLUME (BILLION UNITS), 2018 – 2025
2.2. MARKET CONSUMPTION VOLUME SPLIT BY REGION (BILLION UNITS), 2018 – 2025
2.3. MARKET CONSUMPTION VOLUME SPLIT BY COUNTRIES (BILLION UNITS), 2018 – 2025
2.4. MARKET REVENUE (BILLION USD), 2018-2025
2.5. MARKET REVENUE SPLIT BY REGION (BILLION UNITS), 2018 – 2025
2.6. ENTERPRISE FIREWALL MARKET REVENUE SPLIT BY COUNTRIES (BILLION UNITS), 2018 – 2025
CHAPTER 3. GLOBAL ENTERPRISE FIREWALL MARKET SUPPLY SIDE ANALYSIS
3.1. ENTERPRISE FIREWALL MARKET PRODUCTION VOLUME (BILLION UNITS), 2018 – 2025
3.2. MARKET PRODUCTION VOLUME SPLIT BY REGION (BILLION UNITS), 2018-2025
3.3. MARKET PRODUCTION VOLUME SPLIT/RANKING BY COUNTRIES (BILLION UNITS), 2018 – 2025
CHAPTER 4. GLOBAL ENTERPRISE FIREWALL MARKET COMPETITIVE SCENARIO & BUSINESS OPPORTUNITY ANALYSIS
4.1. COMPETITIVE STRENGTH RANKING BY MAJOR COUNTRIES, 2018
4.2. MARKET ATTRACTIVENESS RANKING BY MAJOR COUNTRIES, 2018 - 2025
4.3. EMERGING BUSINESS OPPORTUNITIES AND GROWTH PROSPECTS
4.3.1. Growth Drivers
4.3.2. Market Restraints
4.3.2. Opportunities
CHAPTER 5. GLOBAL ENTERPRISE FIREWALL MARKET ENTRY STRATEGIES
5.1. ENTRY STRATEGIES IN DEVELOPING MARKETS
5.2. ENTRY STRATEGIES IN DEVELOPED MARKETS
CHAPTER 6. GLOBAL ENTERPRISE FIREWALL MARKET BY TYPE
6.1. SEGMENT OUTLINE
6.2. REVENUE SHARE BY TYPE, $BILLION, 2018 – 2025
6.2. CONSUMPTION SHARE BY TYPE, BILLION UNITS, 2018 - 2025
6.3. PRODUCTION SHARE BY TYPE, BILLION UNITS, 2018 – 2025
6.4. CONVENTIONAL FIREWALL
6.4.1. Market determinants and trend analysis
6.4.2. Market revenue, sales and production volume, 2018 – 2025
6.5. NEXT GENERATION FIREWALL (NGFW)
6.5.1. Market determinants and trend analysis
6.5.2. Market revenue, sales and production volume, 2018 – 2025
6.6. APPLICATION FIREWALL
6.6.1. Market determinants and trend analysis
6.6.2. Market revenue, sales and production volume, 2018 – 2025
CHAPTER 7. GLOBAL ENTERPRISE FIREWALL MARKET BY DEPLOYMENT
7.1. SEGMENT OUTLINE
7.2. REVENUE SHARE BY DEPLOYMENT, $BILLION, 2018 – 2025
7.2. CONSUMPTION SHARE BY DEPLOYMENT, BILLION UNITS, 2018 - 2025
7.3. PRODUCTION SHARE BY DEPLOYMENT, BILLION UNITS, 2018 – 2025
7.4. CLOUD
7.4.1. Market determinants and trend analysis
7.4.2. Market revenue, sales and production volume, 2018 – 2025
7.5. ON PREMISE
7.5.1. Market determinants and trend analysis
7.5.2. Market revenue, sales and production volume, 2018 – 2025
CHAPTER 8. GLOBAL ENTERPRISE FIREWALL MARKET BY ORGANIZATION SIZE
8.1. SEGMENT OUTLINE
8.2. REVENUE SHARE BY ORGANIZATION SIZE, $BILLION, 2018 – 2025
8.2. CONSUMPTION SHARE BY ORGANIZATION SIZE, BILLION UNITS, 2018 - 2025
8.3. PRODUCTION SHARE BY ORGANIZATION SIZE, BILLION UNITS, 2018 – 2025
8.4. SMALL ENTERPRISES
8.4.1. Market determinants and trend analysis
8.4.2. Market revenue, sales and production volume, 2018 – 2025
8.5. MEDIUM ENTERPRISES
8.5.1. Market determinants and trend analysis
8.5.2. Market revenue, sales and production volume, 2018 – 2025
8.6. LARGE ENTERPRISES
8.6.1. Market determinants and trend analysis
8.6.2. Market revenue, sales and production volume, 2018 – 2025
CHAPTER 9. GLOBAL ENTERPRISE FIREWALL MARKET BY ORGANIZATION
9.1. SEGMENT OUTLINE
9.2. REVENUE SHARE BY ORGANIZATION, $BILLION, 2018 – 2025
9.2. CONSUMPTION SHARE BY ORGANIZATION, BILLION UNITS, 2018 - 2025
9.3. PRODUCTION SHARE BY ORGANIZATION, BILLION UNITS, 2018 – 2025
9.4. GOVERNMENT AND PUBLIC UTILITIES
9.4.1. Market determinants and trend analysis
9.4.2. Market revenue, sales and production volume, 2018 – 2025
9.5. TELECOMMUNICATION
9.5.1. Market determinants and trend analysis
9.5.2. Market revenue, sales and production volume, 2018 – 2025
9.6. HEALTHCARE
9.6.1. Market determinants and trend analysis
9.6.2. Market revenue, sales and production volume, 2018 – 2025
9.7. BFSI
9.7.1. Market determinants and trend analysis
9.7.2. Market revenue, sales and production volume, 2018 – 2025
9.8. MANUFACTURING
9.8.1. Market determinants and trend analysis
9.8.2. Market revenue, sales and production volume, 2018 – 2025
9.9. RETAIL
9.9.1. Market determinants and trend analysis
9.9.2. Market revenue, sales and production volume, 2018 – 2025
9.10. EDUCATION
9.10.1. Market determinants and trend analysis
9.10.2. Market revenue, sales and production volume, 2018 – 2025
9.11. ENTERTAINMENT
9.11.1. Market determinants and trend analysis
9.11.2. Market revenue, sales and production volume, 2018 – 2025
9.12. MEDIA
9.12.1. Market determinants and trend analysis
9.12.2. Market revenue, sales and production volume, 2018 – 2025
9.12. OTHERS
9.12.1. Market determinants and trend analysis
9.12.2. Market revenue, sales and production volume, 2018 – 2025
CHAPTER 10. GLOBAL ENTERPRISE FIREWALL MARKET BY REGIONS
10.1. REGIONAL OUTLOOK
10.2. MARKET PRODUCTION, CONSUMPTION & REVENUE BY REGION, 2018-2025
10.3. NORTH AMERICA
10.3.1. Current Trends and Future Prospects
10.3.2. North America market revenue, sales and production volume, 2018 – 2025
10.3.3. The U.S.
10.3.3.1. Enterprise Firewall Market Revenue $BILLION (2018 – 2025)
10.3.3.2. Enterprise Firewall Market Consumption BILLION Units (2018 – 2025)
10.3.3.3. Enterprise Firewall Market Production BILLION Units (2018 – 2025)
10.3.4. Canada
10.3.4.1. Enterprise Firewall Market Revenue $BILLION (2018 – 2025)
10.3.4.2. Enterprise Firewall Market Consumption BILLION Units (2018 – 2025)
10.3.4.3. Enterprise Firewall Market Production BILLION Units (2018 – 2025)
10.3.5. Mexico
10.3.5.1. Enterprise Firewall Market Revenue $BILLION (2018 – 2025)
10.3.5.2. Enterprise Firewall Market Consumption BILLION Units (2018 – 2025)
10.3.5.3. Enterprise Firewall Market Production BILLION Units (2018 – 2025)
10.4. EUROPE
10.4.1. Current Trends and Future Prospects
10.4.2. Europe market revenue, sales and production volume, 2018 – 2025
10.4.3. U.K
10.4.3.1. Enterprise Firewall Market Revenue $BILLION (2018 – 2025)
10.4.3.2. Enterprise Firewall Market Consumption BILLION Units (2018 – 2025)
10.4.3.3. Enterprise Firewall Market Production BILLION Units (2018 – 2025)
10.4.4. Germany
10.4.4.1. Enterprise Firewall Market Revenue $BILLION (2018 – 2025)
10.4.4.2. Enterprise Firewall Market Consumption BILLION Units (2018 – 2025)
10.4.4.3. Enterprise Firewall Market Production BILLION Units (2018 – 2025)
10.4.5. France
10.4.5.1. Enterprise Firewall Market Revenue $BILLION (2018 – 2025)
10.4.5.2. Enterprise Firewall Market Consumption BILLION Units (2018 – 2025)
10.4.5.3. Enterprise Firewall Market Production BILLION Units (2018 – 2025)
10.4.6. Italy
10.4.6.1. Enterprise Firewall Market Revenue $BILLION (2018 – 2025)
10.4.6.2. Enterprise Firewall Market Consumption BILLION Units (2018 – 2025)
10.4.6.3. Enterprise Firewall Market Production BILLION Units (2018 – 2025)
10.4.7. Rest of Europe
10.4.7.1. Enterprise Firewall Market Revenue $BILLION (2018 – 2025)
10.4.7.2. Enterprise Firewall Market Consumption BILLION Units (2018 – 2025)
10.4.7.3. Enterprise Firewall Market Production BILLION Units (2018 – 2025)
10.5. ASIA PACIFIC
10.5.1. Current Trends and Future Prospects
10.5.2. Europe market revenue, sales and production volume, 2018 – 2025
10.5.3. India
10.5.3.1. Enterprise Firewall Market Revenue $BILLION (2018 – 2025)
10.5.3.2. Enterprise Firewall Market Consumption BILLION Units (2018 – 2025)
10.5.3.3. Enterprise Firewall Market Production BILLION Units (2018 – 2025)
10.5.4. Japan
10.5.4.1. Enterprise Firewall Market Revenue $BILLION (2018 – 2025)
10.5.4.2. Enterprise Firewall Market Consumption BILLION Units (2018 – 2025)
10.5.4.3. Enterprise Firewall Market Production BILLION Units (2018 – 2025)
10.5.5. China
10.5.5.1. Enterprise Firewall Market Revenue $BILLION (2018 – 2025)
10.5.5.2. Enterprise Firewall Market Consumption BILLION Units (2018 – 2025)
10.5.5.3. Enterprise Firewall Market Production BILLION Units (2018 – 2025)
10.5.6. South Korea
10.5.6.1. Enterprise Firewall Market Revenue $BILLION (2018 – 2025)
10.5.6.2. Enterprise Firewall Market Consumption BILLION Units (2018 – 2025)
10.5.6.3. Enterprise Firewall Market Production BILLION Units (2018 – 2025)
10.5.7. Rest of APAC
10.5.7.1. Enterprise Firewall Market Revenue $BILLION (2018 – 2025)
10.5.7.2. Enterprise Firewall Market Consumption BILLION Units (2018 – 2025)
10.5.7.3. Enterprise Firewall Market Production BILLION Units (2018 – 2025)
10.6. REST OF THE WORLD
10.6.1. Current Trends and Future Prospects
10.6.2. Europe market revenue, sales and production volume, 2018 – 2025
10.6.3. Latin America
10.6.3.1. Enterprise Firewall Market Revenue $BILLION (2018 – 2025)
10.6.3.2. Enterprise Firewall Market Consumption BILLION Units (2018 – 2025)
10.6.3.3. Enterprise Firewall Market Production BILLION Units (2018 – 2025)
10.6.4. Middle East
10.6.4.1. Enterprise Firewall Market Revenue $BILLION (2018 – 2025)
10.6.4.2. Enterprise Firewall Market Consumption BILLION Units (2018 – 2025)
10.6.4.3. Enterprise Firewall Market Production BILLION Units (2018 – 2025)
10.6.5. Africa
10.6.5.1. Enterprise Firewall Market Revenue $BILLION (2018 – 2025)
10.6.5.2. Enterprise Firewall Market Consumption BILLION Units (2018 – 2025)
10.6.5.3. Enterprise Firewall Market Production BILLION Units (2018 – 2025)
CHAPTER 11. KEY VENDOR PROFILES
11.1. Juniper Networks
11.1.1. Company overview
11.1.2. Portfolio Analysis
11.1.3. Estimated revenue from enterprise firewall business and market share
11.1.4. Regional & business segment Revenue Analysis
11.2. Cisco Systems
11.2.1. Company overview
11.2.2. Portfolio Analysis
11.2.3. Estimated revenue from enterprise firewall business and market share
11.2.4. Regional & business segment Revenue Analysis
11.3. Dell SonicWall
11.3.1. Company overview
11.3.2. Portfolio Analysis
11.3.3. Estimated revenue from enterprise firewall business and market share
11.3.4. Regional & business segment Revenue Analysis
11.4. WatchGuard
11.4.1. Company overview
11.4.2. Portfolio Analysis
11.4.3. Estimated revenue from enterprise firewall business and market share
11.4.4. Regional & business segment Revenue Analysis
11.5. Fortinet
11.5.1. Company overview
11.5.2. Portfolio Analysis
11.5.3. Estimated revenue from enterprise firewall business and market share
11.5.4. Regional & business segment Revenue Analysis
11.6. Palo Alto Networks
11.6.1. Company overview
11.6.2. Portfolio Analysis
11.6.3. Estimated revenue from enterprise firewall business and market share
11.6.4. Regional & business segment Revenue Analysis
11.7. McAfee
11.7.1. Company overview
11.7.2. Portfolio Analysis
11.7.3. Estimated revenue from enterprise firewall business and market share
11.7.4. Regional & business segment Revenue Analysis
11.8. AlgoSec
11.8.1. Company overview
11.8.2. Portfolio Analysis
11.8.3. Estimated revenue from enterprise firewall business and market share
11.8.4. Regional & business segment Revenue Analysis
11.9. Imperva
11.9.1. Company overview
11.9.2. Portfolio Analysis
11.9.3. Estimated revenue from enterprise firewall business and market share
11.9.4. Regional & business segment Revenue Analysis
11.10. Check Point
11.10.1. Company overview
11.10.2. Portfolio Analysis
11.10.3. Estimated revenue from enterprise firewall business and market share
11.10.4. Regional & business segment Revenue Analysis
PURCHASE OPTIONS
20% Free Customization ON ALL PURCHASE
*Terms & Conditions Apply
Looking for report on this market in a particular region or country? Get In Touch
Request Free Sample
Please fill in the form below to Request for free Sample Report
-
Office Hours Mon - Sat 10:00 - 16:00
-
Call Us +91 6201075429
-
Send Us Mail sales@marketdecipher.com
Market Decipher is a market research and consultancy firm involved in provision of market reports to organisations of varied sizes; small, large and medium.

© 2018 Market Decipher. All Rights Reserved