Image Sensor Market
By Technology (CCD and CMOS), By Application (Security, Consumer Electronics, Automotive, Surveillance, Defense and Medical), By processing type (3D and 2D), By Spectrum (Visible and Non-Visible), By Region (North America, Europe, APAC and Rest of the World)
- Report ID : MD1054 |
- Pages : 155 |
- Tables : 110 |
- Formats :


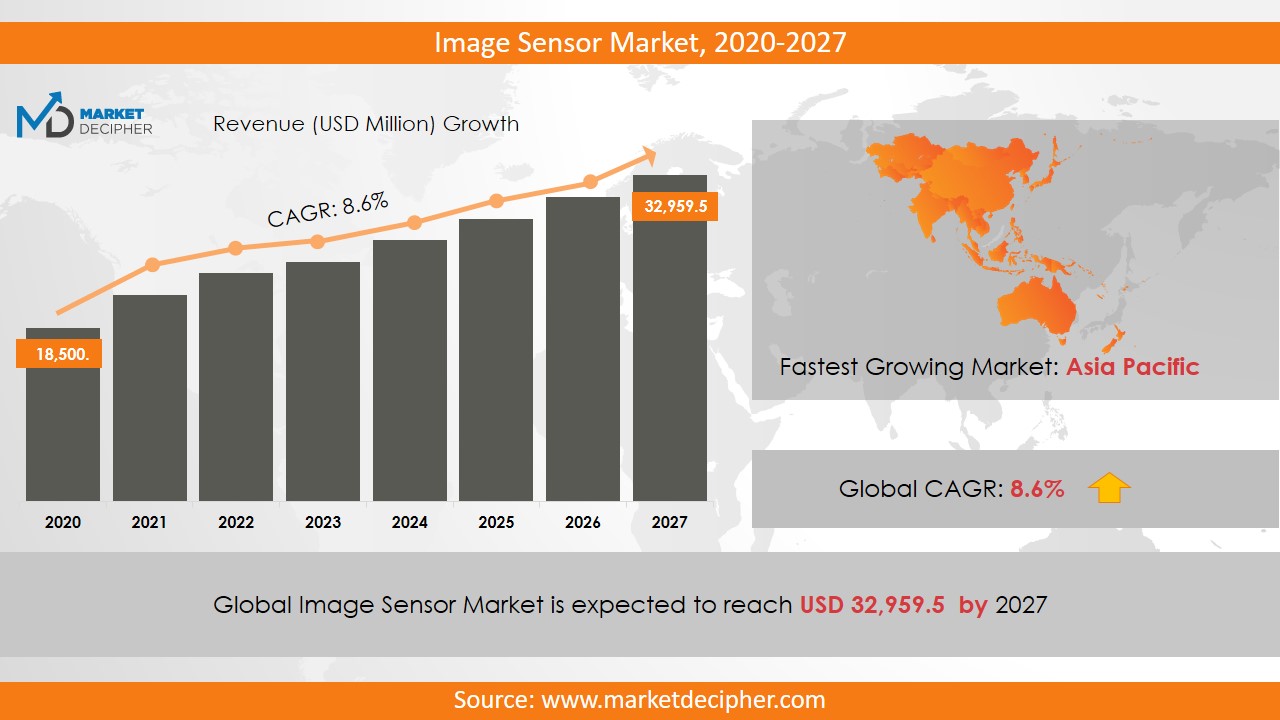
Image Sensor market revenue shall reach a value of $26.22 Billion in 2026, growing with a CAGR of 6.4% during the forecast period of 2018 to 2026. In terms of volume sales, the market is anticipated to reach XX Units.
An image sensor is an electronic device that receives an electronic signal from an optical image. It is used extensively in digital cameras and other imaging devices. The rising trend of smartphones with dual cameras and miniaturization is anticipated to boost up the image sensors market sales significantly over the forecast period. Further, the demand for superior imaging in the medical sector is also anticipated to expand the market growth tremendously over the forecast period. The increasing demand for the enhanced and high definition digital cameras is increasing the application of image sensors considerably. Additionally, the demand for the electronic devices which support social media such as laptops, smartphones, and tablets has increased significantly over time which also uses image sensors greatly.
The low cost of production is another key factor in increasing the image sensors market size. These sensors are equipped with various enhanced features such as less power consumption and extended battery life. The wide application of these sensors in various fields like video conferencing, optical mic, digital cameras, biometrics, and camcorders is expected to boost up image sensors market shares substantially. Further, the launch of the newest edition of the EOS DSLR has been announced by Canon Incorporated in June 2017.
REGIONAL ANALYSIS
The North America region has contributed substantially in 2018 and is expected to continue the same trend over the forecast period. Further, the Asia Pacific region is growing at a significant rate owing to the increasing investment by developing economies such as South Korea, India, Japan, and China. Moreover, due to a significant CAGR growth percentage, this region is anticipated to witness the highest growth in the market shares over the forecast period.
SEGMENT ANALYSIS
Image sensors market research divides these sensors as CCD and CMOS based on technology. Out of which the CMOS segment has gained the highest share of the industry and is anticipated to grow at the fastest rate over the forecast period. Based on application, the market has been bifurcated as security, consumer electronics, automotive, surveillance, defense and medical. In 2018, the motor vehicle segment has shown its dominance in terms of revenue. These sensors are widely used in many aspects such as driver support and security-related technologies.
In addition to enabling departure warnings and functions, these sensors are widely used to click on the 360-degree surround image. Based on the spectrum, images sensors are of two types: visible and non-visible. In terms of processing time, the market has been segmented as 3D and 2D. Image sensor manufacturers are currently focusing on improving their efficiency and looking towards a more practical and technologically advanced approach than the traditional approach of production, which ensures its high demand shortly.
INDUSTRY PLAYER ANALYSIS
Major industry players have been analyzed with coverage on their operating areas, revenues, and other strategic aspects. These industry players include Panasonic Corporation, ST Microelectronics, Sony Corporation, Samsung Electronics Corporation limited, Canon Incorporated, Toshiba Corporation, SK Hynix, Omni vision, Hymax, Teledyne and Sharp Corporation
COVERAGE HIGHLIGHTS
• Revenue Estimation and Forecast (2018 – 2026)
• Production Estimation and Forecast (2018 – 2026)
• Sales/Consumption Volume Estimation and Forecast (2018 – 2026)
• Breakdown of Revenue by Segments (2018 – 2026)
• Breakdown of Production by Segments (2018 – 2026)
• Breakdown of Sales Volume by Segments (2018 – 2026)
• Gross Margin and Profitability Analysis of Companies
• Business Trend and Expansion Analysis
• Import and Export Analysis
• Regional Analysis and Data Breakdown
SEGMENTAL ANALYSIS:
By Technology Outlook ($Revenue and Unit Sales, 2018-2026)
• CCD
• CMOS
By Processing Type Outlook ($Revenue and Unit Sales, 2018-2026)
• 3D
• 2D
By Technology Outlook ($Revenue and Unit Sales, 2018-2026)
• Non-visible
• Visible
By Application Outlook ($Revenue and Unit Sales, 2018-2026)
• Security
• Consumer electronics
• Automotive
• Surveillance
• Defense
• Medical
By Regional Outlook ($Revenue and Unit Sales, 2018-2026)
• North America
• Canada
• U.S
• Mexico
• Europe
• Germany
• France
• U.K
• Rest of Europe
• Asia-Pacific
• China
• India
• Japan
• Rest of Asia Pacific
• Rest of the World
• Middle East
• Africa
• Latin America
CHAPTER 1. INTRODUCTION
1.1. RESEARCH METHODOLOGY
1.1.1. Data Collection
1.1.2. Data Modeling
1.1.3. Historical Revenue and Sales Estimation
1.1.4. Data Triangulation
1.2. RESEARCH PROCESS
1.2.1. Primary Research
1.2.2. Secondary Research
1.2.3. Survey Data
1.2.4. Validation by In-House Expert
1.3. IMAGE SENSOR MARKET OVERVIEW
1.3.1. Research Scope and Market Definition
1.3.2. Executive Summary
CHAPTER 2. GLOBAL IMAGE SENSOR MARKET DEMAND SIDE ANALYSIS
2.1. IMAGE SENSOR MARKET CONSUMPTION VOLUME (BILLION UNITS), 2018 – 2025
2.2. MARKET CONSUMPTION VOLUME SPLIT BY REGION (BILLION UNITS), 2018 – 2025
2.3. MARKET CONSUMPTION VOLUME SPLIT BY COUNTRIES (BILLION UNITS), 2018 – 2025
2.4. MARKET REVENUE (BILLION USD), 2018-2025
2.5. MARKET REVENUE SPLIT BY REGION (BILLION UNITS), 2018 – 2025
2.6. IMAGE SENSOR MARKET REVENUE SPLIT BY COUNTRIES (BILLION UNITS), 2018 – 2025
CHAPTER 3. GLOBAL IMAGE SENSOR MARKET SUPPLY SIDE ANALYSIS
3.1. IMAGE SENSOR MARKET PRODUCTION VOLUME (BILLION UNITS), 2018 – 2025
3.2. MARKET PRODUCTION VOLUME SPLIT BY REGION (BILLION UNITS), 2018-2025
3.3. MARKET PRODUCTION VOLUME SPLIT/RANKING BY COUNTRIES (BILLION UNITS), 2018 – 2025
CHAPTER 4. GLOBAL IMAGE SENSOR MARKET COMPETITIVE SCENARIO & BUSINESS OPPORTUNITY ANALYSIS
4.1. COMPETITIVE STRENGTH RANKING BY MAJOR COUNTRIES, 2018
4.2. MARKET ATTRACTIVENESS RANKING BY MAJOR COUNTRIES, 2018 - 2025
4.3. EMERGING BUSINESS OPPORTUNITIES AND GROWTH PROSPECTS
4.3.1. Growth Drivers
4.3.2. Market Restraints
4.3.2. Opportunities
CHAPTER 5. GLOBAL IMAGE SENSOR MARKET ENTRY STRATEGIES
5.1. ENTRY STRATEGIES IN DEVELOPING MARKETS
5.2. ENTRY STRATEGIES IN DEVELOPED MARKETS
CHAPTER 6. GLOBAL IMAGE SENSOR MARKET BY TECHNOLOGY
6.1. SEGMENT OUTLINE
6.2. REVENUE SHARE BY TECHNOLOGY, $BILLION, 2018 – 2025
6.2. CONSUMPTION SHARE BY TECHNOLOGY, BILLION UNITS, 2018 - 2025
6.3. PRODUCTION SHARE BY TECHNOLOGY, BILLION UNITS, 2018 – 2025
6.4. CCD
6.4.1. Market determinants and trend analysis
6.4.2. Market revenue, sales and production volume, 2018 – 2025
CHAPTER 7. GLOBAL IMAGE SENSOR MARKET BY PROCESSING TYPE
7.1. SEGMENT OUTLINE
7.2. REVENUE SHARE BY PROCESSING TYPE, $BILLION, 2018 – 2025
7.2. CONSUMPTION SHARE BY PROCESSING TYPE, BILLION UNITS, 2018 - 2025
7.3. PRODUCTION SHARE BY PROCESSING TYPE, BILLION UNITS, 2018 – 2025
7.4. 3D
7.4.1. Market determinants and trend analysis
7.4.2. Market revenue, sales and production volume, 2018 – 2025
7.5. 2D
7.5.1. Market determinants and trend analysis
7.5.2. Market revenue, sales and production volume, 2018 – 2025
CHAPTER 8. GLOBAL IMAGE SENSOR MARKET BY TECHNOLOGY
8.1. SEGMENT OUTLINE
8.2. REVENUE SHARE BY TECHNOLOGY, $BILLION, 2018 – 2025
8.2. CONSUMPTION SHARE BY TECHNOLOGY, BILLION UNITS, 2018 - 2025
8.3. PRODUCTION SHARE BY TECHNOLOGY, BILLION UNITS, 2018 – 2025
8.4. NON-VISIBLE
8.4.1. Market determinants and trend analysis
8.4.2. Market revenue, sales and production volume, 2018 – 2025
8.5. VISIBLE
8.5.1. Market determinants and trend analysis
8.5.2. Market revenue, sales and production volume, 2018 – 2025
CHAPTER 9. GLOBAL IMAGE SENSOR MARKET BY APPLICATION
9.1. SEGMENT OUTLINE
9.2. REVENUE SHARE BY APPLICATION, $BILLION, 2018 – 2025
9.2. CONSUMPTION SHARE BY APPLICATION, BILLION UNITS, 2018 - 2025
9.3. PRODUCTION SHARE BY APPLICATION, BILLION UNITS, 2018 – 2025
9.4. SECURITY
9.4.1. Market determinants and trend analysis
9.4.2. Market revenue, sales and production volume, 2018 – 2025
9.5. CONSUMER ELECTRONICS
9.5.1. Market determinants and trend analysis
9.5.2. Market revenue, sales and production volume, 2018 – 2025
9.6. AUTOMOTIVE
9.6.1. Market determinants and trend analysis
9.6.2. Market revenue, sales and production volume, 2018 – 2025
9.7. SURVEILLANCE
9.7.1. Market determinants and trend analysis
9.7.2. Market revenue, sales and production volume, 2018 – 2025
9.8. DEFENSE
9.8.1. Market determinants and trend analysis
9.8.2. Market revenue, sales and production volume, 2018 – 2025
9.9. MEDICAL
9.9.1. Market determinants and trend analysis
9.9.2. Market revenue, sales and production volume, 2018 – 2025
CHAPTER 10. GLOBAL IMAGE SENSOR MARKET BY REGIONS
10.1. REGIONAL OUTLOOK
10.2. MARKET PRODUCTION, CONSUMPTION & REVENUE BY REGION, 2018-2025
10.3. NORTH AMERICA
10.3.1. Current Trends and Future Prospects
10.3.2. North America market revenue, sales and production volume, 2018 – 2025
10.3.3. U.S.
10.3.3.1. Image Sensor Market Revenue $BILLION (2018 – 2025)
10.3.3.2. Image Sensor Market Consumption Billion Units (2018 – 2025)
10.3.3.3. Image Sensor Market Production Billion Units (2018 – 2025)
10.3.4. Canada
10.3.4.1. Image Sensor Market Revenue $BILLION (2018 – 2025)
10.3.4.2. Image Sensor Market Consumption Billion Units (2018 – 2025)
10.3.4.3. Image Sensor Market Production Billion Units (2018 – 2025)
10.3.5. Mexico
10.3.5.1. Image Sensor Market Revenue $BILLION (2018 – 2025)
10.3.5.2. Image Sensor Market Consumption Billion Units (2018 – 2025)
10.3.5.3. Image Sensor Market Production Billion Units (2018 – 2025)
10.4. EUROPE
10.4.1. Current Trends and Future Prospects
10.4.2. Europe market revenue, sales and production volume, 2018 – 2025
10.4.3. U.K
10.4.3.1. Image Sensor Market Revenue $BILLION (2018 – 2025)
10.4.3.2. Image Sensor Market Consumption Billion Units (2018 – 2025)
10.4.3.3. Image Sensor Market Production Billion Units (2018 – 2025)
10.4.4. Germany
10.4.4.1. Image Sensor Market Revenue $BILLION (2018 – 2025)
10.4.4.2. Image Sensor Market Consumption Billion Units (2018 – 2025)
10.4.4.3. Image Sensor Market Production Billion Units (2018 – 2025)
10.4.5. France
10.4.5.1. Image Sensor Market Revenue $BILLION (2018 – 2025)
10.4.5.2. Image Sensor Market Consumption Billion Units (2018 – 2025)
10.4.5.3. Image Sensor Market Production Billion Units (2018 – 2025)
10.4.6. Italy
10.4.6.1. Image Sensor Market Revenue $BILLION (2018 – 2025)
10.4.6.2. Image Sensor Market Consumption Billion Units (2018 – 2025)
10.4.6.3. Image Sensor Market Production Billion Units (2018 – 2025)
10.4.7. Rest of Europe
10.4.7.1. Image Sensor Market Revenue $BILLION (2018 – 2025)
10.4.7.2. Image Sensor Market Consumption Billion Units (2018 – 2025)
10.4.7.3. Image Sensor Market Production Billion Units (2018 – 2025)
10.5. ASIA PACIFIC
10.5.1. Current Trends and Future Prospects
10.5.2. Europe market revenue, sales and production volume, 2018 – 2025
10.5.3. India
10.5.3.1. Image Sensor Market Revenue $BILLION (2018 – 2025)
10.5.3.2. Image Sensor Market Consumption Billion Units (2018 – 2025)
10.5.3.3. Image Sensor Market Production Billion Units (2018 – 2025)
10.5.4. Japan
10.5.4.1. Image Sensor Market Revenue $BILLION (2018 – 2025)
10.5.4.2. Image Sensor Market Consumption Billion Units (2018 – 2025)
10.5.4.3. Image Sensor Market Production Billion Units (2018 – 2025)
10.5.5. China
10.5.5.1. Image Sensor Market Revenue $BILLION (2018 – 2025)
10.5.5.2. Image Sensor Market Consumption Billion Units (2018 – 2025)
10.5.5.3. Image Sensor Market Production Billion Units (2018 – 2025)
10.5.6. South Korea
10.5.6.1. Image Sensor Market Revenue $BILLION (2018 – 2025)
10.5.6.2. Image Sensor Market Consumption Billion Units (2018 – 2025)
10.5.6.3. Image Sensor Market Production Billion Units (2018 – 2025)
10.5.7. Rest of APAC
10.5.7.1. Image Sensor Market Revenue $BILLION (2018 – 2025)
10.5.7.2. Image Sensor Market Consumption Billion Units (2018 – 2025)
10.5.7.3. Image Sensor Market Production Billion Units (2018 – 2025)
10.6. REST OF THE WORLD
10.6.1. Current Trends and Future Prospects
10.6.2. Europe market revenue, sales and production volume, 2018 – 2025
10.6.3. Latin America
10.6.3.1. Image Sensor Market Revenue $BILLION (2018 – 2025)
10.6.3.2. Image Sensor Market Consumption Billion Units (2018 – 2025)
10.6.3.3. Image Sensor Market Production Billion Units (2018 – 2025)
10.6.4. Middle East
10.6.4.1. Image Sensor Market Revenue $BILLION (2018 – 2025)
10.6.4.2. Image Sensor Market Consumption Billion Units (2018 – 2025)
10.6.4.3. Image Sensor Market Production Billion Units (2018 – 2025)
10.6.5. Africa
10.6.5.1. Image Sensor Market Revenue $BILLION (2018 – 2025)
10.6.5.2. Image Sensor Market Consumption Billion Units (2018 – 2025)
10.6.5.3. Image Sensor Market Production Billion Units (2018 – 2025)
CHAPTER 11. KEY VENDOR PROFILES
11.1. Panasonic Corporation
11.1.1. Company overview
11.1.2. Portfolio Analysis
11.1.3. Estimated revenue from image sensor business and market share
11.1.4. Regional & business segment Revenue Analysis
11.2. ST Microelectronics
11.2.1. Company overview
11.2.2. Portfolio Analysis
11.2.3. Estimated revenue from image sensor business and market share
11.2.4. Regional & business segment Revenue Analysis
11.3. Sony Corporation
11.3.1. Company overview
11.3.2. Portfolio Analysis
11.3.3. Estimated revenue from image sensor business and market share
11.3.4. Regional & business segment Revenue Analysis
11.4. Samsung electronics corporation limited
11.4.1. Company overview
11.4.2. Portfolio Analysis
11.4.3. Estimated revenue from image sensor business and market share
11.4.4. Regional & business segment Revenue Analysis
11.5. Canon Incorporated
11.5.1. Company overview
11.5.2. Portfolio Analysis
11.5.3. Estimated revenue from image sensor business and market share
11.5.4. Regional & business segment Revenue Analysis
11.6. Toshiba Corporation
11.6.1. Company overview
11.6.2. Portfolio Analysis
11.6.3. Estimated revenue from image sensor business and market share
11.6.4. Regional & business segment Revenue Analysis
11.7. SK Hynix
11.7.1. Company overview
11.7.2. Portfolio Analysis
11.7.3. Estimated revenue from image sensor business and market share
11.7.4. Regional & business segment Revenue Analysis
11.8. Omni vision
11.8.1. Company overview
11.8.2. Portfolio Analysis
11.8.3. Estimated revenue from image sensor business and market share
11.8.4. Regional & business segment Revenue Analysis
11.9. Hymax
11.9.1. Company overview
11.9.2. Portfolio Analysis
11.9.3. Estimated revenue from image sensor business and market share
11.9.4. Regional & business segment Revenue Analysis
11.10. Teledyne
11.10.1. Company overview
11.10.2. Portfolio Analysis
11.10.3. Estimated revenue from image sensor business and market share
11.10.4. Regional & business segment Revenue Analysis
11.11. Sharp Corporation
11.11.1. Company overview
11.11.2. Portfolio Analysis
11.11.3. Estimated revenue from image sensor business and market share
11.11.4. Regional & business segment Revenue Analysis
PURCHASE OPTIONS
20% Free Customization ON ALL PURCHASE
*Terms & Conditions Apply
Looking for report on this market in a particular region or country? Get In Touch
Request Free Sample
Please fill in the form below to Request for free Sample Report
-
Office Hours Mon - Sat 10:00 - 16:00
-
Call Us +91 6201075429
-
Send Us Mail sales@marketdecipher.com
Market Decipher is a market research and consultancy firm involved in provision of market reports to organisations of varied sizes; small, large and medium.

© 2018 Market Decipher. All Rights Reserved