Off-road Tires Market Size, Statistics, Trend Analysis and Forecast Report, 2020 - 2027
By Material (Synthetic Rubber, Natural Rubber, Fabrics & Wire, Carbon Black), By Tire Height (Below 31 Inches, 31-40 Inches, 41-45 Inches, Above 45 Inches), By Vehicle (4WD HDT, SUV, UTV, Dirt Bikes & Quad, OTR), By Distribution Channel (Original Equipment, Secondary/Replacement, Distributor/Dealer Equipped), Industry Analysis Report, Regional Outlook (U.S., Canada, Germany, UK, France, Italy, Spain, China, India, Japan, Australia, South Korea, Thailand, Indonesia, Brazil, Mexico, Argentina, Saudi Arabia, UAE, Kuwait, South Africa)
- Report ID : MD1442 |
- Pages : 240 |
- Tables : 85 |
- Formats :


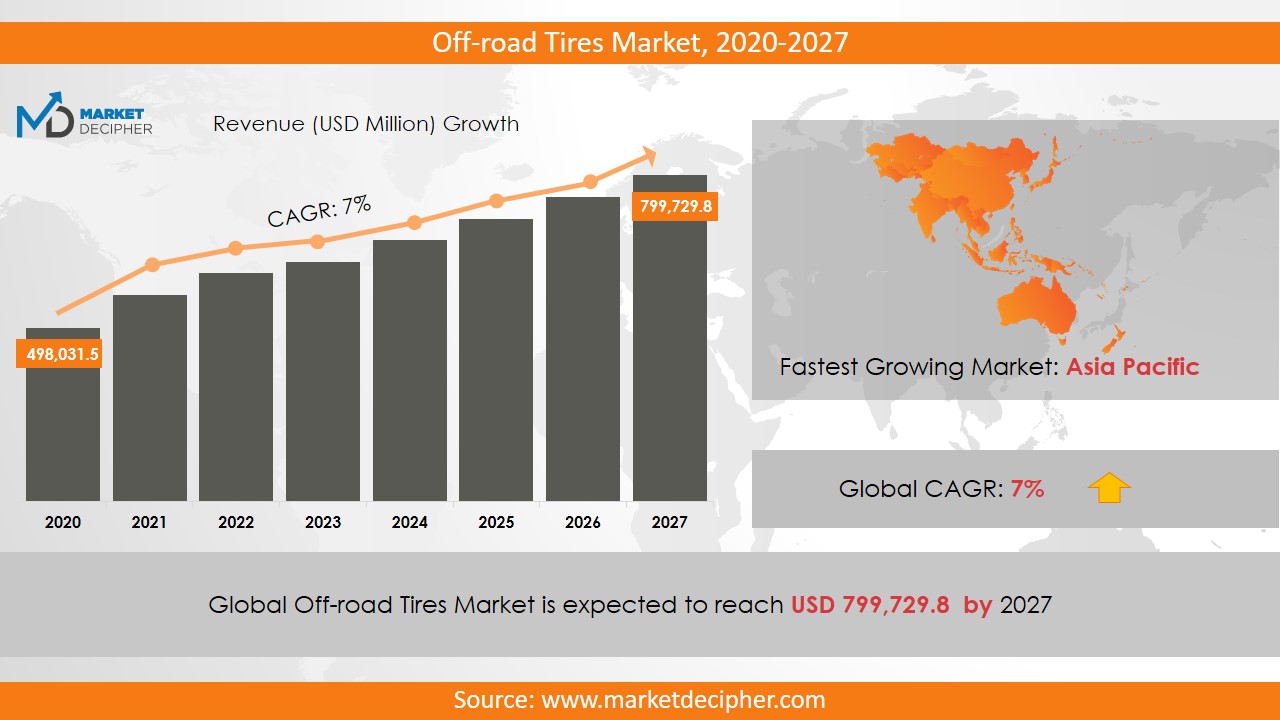
Off-road Tires Market size was estimated at $498,031.5 Million in 2019 and is expected to reach $799,729.8 Million by 2027, growing at a CAGR of 7% during the forecast period of 2020 to 2027.
Off-road tires are meant for tougher terrain than the tarmac that is usually encountered. They are particularly useful in gravel, muddy and rocky surfaces. They have larger gaps to aid in driving over the loose surfaces. Governing organizations include JATMA (Japan Automobile Tyre Manufacturers Association), ETRMA (European Tyre and Rubber Manufacturers Association) and the popularly known ASTM (American Society of Testing and Materials).
Analysis by Material
Raw materials used in making the tires play a vital role in their performance. Variants of synthetic rubber contributed a significant amount of market share to the off-road tires market size. SBR (Styrene Butadiene Rubber) and BR (Butadiene rubber) are used extensively in agriculture and mining equipments. Innovations in this field keep surfacing from time to time and contribute to the tires’ energy efficiency. The future of Natural rubber is very promising owing to its excellent strength and durability in harsh terrains. It will showcase a considerable growth over the forecast timeframe.
Analysis by Tire Height
SUVs, UTVs, dirt bikes and quads utilize tires sized below 31 inches. The demand for SUVs is increasing as is evident by the evolving consumer needs for more torque. Thus, a strong supply of tires in this product line will have an excellent market need to fulfil.
Agricultural and Off-road vehicles have seen a positive growth. In the process, the utilization of tires sized above 45 inches has also grown at a rapid pace. The market demand of Heavy-duty tires is also aided by the growing mining sector which employs a lot of back-hoe loaders. Additionally, automation in the farming sector is also a big boost to this product line.
Analysis by Vehicles
UTVs are set to record admirable growth on construction sites and racing championships. Customers’ prefer tires with optimum comfort and long operational life. This will lead the segment penetration. On the other side, mountain bikes and agricultural vehicles are also on the rise. Latest tires offer enhanced freight carrying capability with increased efficiency. Another aspect that will help in increasing the market capitalization is the reduction in environmental impact, which is being looked into very closely by the modern consumer.
Analysis by Distribution Channel
Sales to vehicle OEMs dominate the market share of off-road tires. This can be easily attributed to attractive financing schemes that are made available to end users. Thus, the value chain moves much faster. Moreover, discounts and the overall ease of purchase of the vehicle makes the customer’s buying experience a breeze.
Next, the replacement segment is also set to scale new heights. This is evident because of a similar, friendly buying experience of customers that is being built. Knowledge flow is key here and customers are paying a lot of attention to the vehicle upkeep, of which tires are an essential part of.
Analysis by Region
The Asia Pacific region is leapfrogging all other geographies combined in the market size of off-road tires. Countries such as China and India are many folds ahead in the consumption owing to their massive overall national growth in infrastructure. As a result, manufacturers are setting up bases in these regions to capitalize on the exciting prospect.
On the other side of the globe, North America has shown an increase in sales of quads and dirt bikes. The distribution is very strong in this part of the globe and will witness excellent growth in the forecast period.
Analysis by Market
When it comes to major market players in this industry, they are JK Tyre & Industries Ltd, Continental AG, Michelin and Bridgestone Corporation. These companies have shown a lot of commitment by way of investments in R&D and product innovation owing to a favourable market eco-system that is developing. Large returns are forecasted by most of these experienced organizations in the value chain.
COVERAGE HIGHLIGHTS
● Market Revenue Estimation and Forecast (2019 – 2026)
● Market Production Estimation and Forecast (2019 – 2026)
● Market Sales/Consumption Volume Estimation and Forecast (2019 – 2026)
● Breakdown of Revenue by Segments (2019 – 2026)
● Breakdown of Production by Segments (2019 – 2026)
● Breakdown of Sales Volume by Segments (2019 – 2026)
● Gross Margin and Profitability Analysis of Companies
● Business Trend and Expansion Analysis
● Import and Export Analysis
● Regional Analysis and Market Data Breakdown
MARKET SEGMENTATION
By Material Outlook ($Revenue and Unit Sales, 2019-2026)
• Synthetic Rubber
• Natural Rubber
• Fabrics and Wire
• Carbon Black
• Others
By Tire Height Outlook ($Revenue and Unit Sales, 2019-2026)
• Below 30 inches
• 31-40 inches
• 41-45 inches
• Above 45 inches
By Vehicle Outlook ($Revenue and Unit Sales, 2019-2026)
• 4WD HDT
• SUV
• UTV
• Dirt bikes and Quad
• OTR
• Others
By Distribution Channel Outlook ($Revenue and Unit Sales, 2019-2026)
• Original equipment
• Secondary/replacement
• Distributor/Dealer equipped
By Regional Outlook ($Revenue and Unit Sales, 2019-2026)
• USA
• Canada
• Germany
• France
• Italy
• Spain
• China
• Japan
• Australia
• India
• South Korea
• Thailand
• Indonesia
• Brazil
• Mexico
• Argentina
• Saudi Arabia
• UAE
• Kuwait
• South Africa
Market Players
• Interco Tire Corporation
• The Yokohama Rubber Co. Ltd
• JK TYRE & INDUSTRIES LTD
• Continental AG
• Michelin
• Nortec
• Maxxis International
• Bridgestone Corporation
• Sumitomo Rubber Industries, Ltd
• Nokian Heavy Tyres Ltd
• Omni United
• Nexen Tire Corporation
• Hankook Tire & Technology Co. Ltd
• Cooper Tire & Rubber Company
• Toyo Tire Corporation
• Pirelli & C. S.p.A
• HengFeng Tires
CHAPTER 1: INTRODUCTION
1.1. RESEARCH METHODOLOGY
1.1.1. Desk Research
1.1.2. Data Synthesis
1.1.3. Data Validation & Market Feedback
1.1.4. Data Sources
CHAPTER 2: EXECUTIVE SUMMARY
2.1. GLOBAL MARKET OUTLOOK
2.2. CORE INSIGHTS –DELIVERY MODEL
2.3. CORE INSIGHTS – OFF-ROAD TIRES
2.4. CORE INSIGHTS – SERVICE PROVIDER
2.5. CORE INSIGHTS – GEOGRAPHY
CHAPTER 3: MARKET OVERVIEW
3.1. MARKET DEFINITION AND SCOPE
3.2. KEY FORCES SHAPING THE INDUSTRY
3.2.1. Bargaining Power of Suppliers
3.2.2. Bargaining Power of Buyers
3.2.3. Threat of Substitutes
3.2.4. Threat of New Entrants
3.3. MARKET DYNAMICS
3.3.1. Drivers
3.3.1.1. Supply-side Drivers
3.3.1.2. Demand-side Drivers
3.3.2. Restraints
3.3.3. Opportunities
3.4. INDUSTRY - ANALYSIS
3.4.1. Political Market
3.4.2. Environmental Market
3.4.3. Social Market
3.4.4. Technology Market
CHAPTER 4: MARKET BACKGROUND
4.1. Industry Value Chain Analysis
4.1.1. Upstream Participants
4.1.2. Downstream participants
4.2. Pricing Analysis and Forecast, 2019-2026
4.2.1. By Type
4.2.2. By Region
CHAPTER 5: OFF-ROAD TIRES MARKET, BY MATERIAL OUTLOOK
5.1. Overview
5.1.1. Market Revenue (US$ Million) and Forecast, 2019-2026
5.2. Synthetic Rubber
5.2.1. Key Market Trends, Growth Factors and Opportunities
5.2.2. Market Revenue (US$ Million) and Forecast, By Region
5.3. Natural Rubber
5.3.1. Key Market Trends, Growth Factors and Opportunities
5.3.2. Market Revenue (US$ Million) and Forecast, By Region
5.4. Fabrics and Wire
5.4.1. Key Market Trends, Growth Factors and Opportunities
5.4.2. Market Revenue (US$ Million) and Forecast, By Region
5.5. Carbon Black
5.5.1. Key Market Trends, Growth Factors and Opportunities
5.5.2. Market Revenue (US$ Million) and Forecast, By Region
5.6. Others
5.6.1. Key Market Trends, Growth Factors and Opportunities
5.6.2. Market Revenue (US$ Million) and Forecast, By Region
CHAPTER 6: OFF-ROAD TIRES MARKET BY TIRE HEIGHT OUTLOOK
6.1. Overview
6.1.1. Market Revenue (US$ Million) and Forecast, 2019-2026
6.2. Below 30 inches
6.2.1. Key Market Trends, Growth Factors and Opportunities
6.2.2. Market Revenue (US$ Million) and Forecast, By Region
6.3. 31-40 inches
6.3.1. Key Market Trends, Growth Factors and Opportunities
6.3.2. Market Revenue (US$ Million) and Forecast, By Region
6.4. 41-45 inches
6.4.1. Key Market Trends, Growth Factors and Opportunities
6.4.2. Market Revenue (US$ Million) and Forecast, By Region
6.5. Above 45 inches
6.5.1. Key Market Trends, Growth Factors and Opportunities
6.5.2. Market Revenue (US$ Million) and Forecast, By Region
CHAPTER 7: OFF-ROAD TIRES MARKET BY VEHICLE OUTLOOK
7.1. Overview
7.1.1. Market Revenue (US$ Million) and Forecast, 2019-2026
7.2. 4WD HDT
7.2.1. Key Market Trends, Growth Factors and Opportunities
7.2.2. Market Revenue (US$ Million) and Forecast, By Region
7.3. SUV
7.3.1. Key Market Trends, Growth Factors and Opportunities
7.4. UTV
7.4.1. Key Market Trends, Growth Factors and Opportunities
7.4.2. Market Revenue (US$ Million) and Forecast, By Region
7.5. Dirt bikes and Quad
7.5.1. Key Market Trends, Growth Factors and Opportunities
7.5.2. Market Revenue (US$ Million) and Forecast, By Region
7.6. OTR
7.6.1. Key Market Trends, Growth Factors and Opportunities
7.6.2. Market Revenue (US$ Million) and Forecast, By Region
7.7. Others
7.7.1. Key Market Trends, Growth Factors and Opportunities
7.7.2. Market Revenue (US$ Million) and Forecast, By Region
CHAPTER 8: OFF-ROAD TIRES MARKET BY DISTRIBUTION CHANNEL OUTLOOK
8.1. Overview
8.1.1. Market Revenue (US$ Million) and Forecast, 2019-2026
8.2. Original equipment
8.2.1. Key Market Trends, Growth Factors and Opportunities
8.2.2. Market Revenue (US$ Million) and Forecast, By Region
8.3. Secondary/replacement
8.3.1. Key Market Trends, Growth Factors and Opportunities
8.3.2. Market Revenue (US$ Million) and Forecast, By Region
8.4. Distributor/Dealer equipped
8.4.1. Key Market Trends, Growth Factors and Opportunities
8.4.2. Market Revenue (US$ Million) and Forecast, By Region
CHAPTER 9: OFF-ROAD TIRES MARKET, BY GEOGRAPHY
9.1. Overview
9.2. North America
9.2.1. Key Market Trends, Growth Factors and Opportunities
9.2.2. Market Revenue and Forecast, By Delivery Model
9.2.3. Market Revenue and Forecast, By Agriculture Type
9.2.4. Market Revenue and Forecast, By Service Provider
9.2.5. Market Revenue and Forecast, By Country
9.2.6. U.S.
9.2.6.1. Market Revenue and Forecast
9.2.7. Canada
9.2.7.1. Market Revenue and Forecast
9.2.8. Mexico
9.2.8.1. Market Revenue and Forecast
9.3. Europe
9.3.1. Market Revenue and Forecast, By Delivery Model
9.3.2. Market Revenue and Forecast, By Agriculture Type
9.3.3. Market Revenue and Forecast, By Service Provider
9.3.4. Market Revenue and Forecast, By Country
9.3.5. Germany
9.3.5.1. Market Revenue and Forecast
9.3.6. UK
9.3.6.1. Market Revenue and Forecast
9.3.7. France
9.3.7.1. Market Revenue and Forecast
9.3.8. Italy
9.3.8.1. Market Revenue and Forecast
9.3.9. Spain
9.3.9.1. Market Revenue and Forecast
9.3.10. Poland
9.3.10.1. Market Revenue and Forecast
9.3.11. Austrai
9.3.11.1. Market Revenue and Forecast
9.3.12. Luxembourg
9.3.12.1. Market Revenue and Forecast
9.3.13. Rest of Europe
9.3.13.1. Market Revenue and Forecast
9.4. Asia-Pacific
9.4.1. Market Revenue and Forecast, By Delivery Model
9.4.2. Market Revenue and Forecast, By Agriculture Type
9.4.3. Market Revenue and Forecast, By Service Provider
9.4.4. Market Revenue and Forecast, By Country
9.4.5. China
9.4.5.1. Market Revenue and Forecast
9.4.6. India
9.4.6.1. Market Revenue and Forecast
9.4.7. Japan
9.4.7.1. Market Revenue and Forecast
9.4.8. South Korea
9.4.8.1. Market Revenue and Forecast
9.4.9. Rest of APAC
9.4.9.1. Market Revenue and Forecast
9.5. REST OF THE WORLD
9.5.1. Market Revenue and Forecast, By Delivery Model
9.5.2. Market Revenue and Forecast, By Agriculture Type
9.5.3. Market Revenue and Forecast, By Service Provider
9.5.4. Market Revenue and Forecast, By Country
9.5.5. Latin America
9.5.5.1. Market Revenue and Forecast
9.5.6. Middle East
9.5.6.1. Market Revenue and Forecast
9.5.7. Africa
9.5.7.1. Market Revenue and Forecast
CHAPTER 10: COMPANY PROFILES
10.1. Airbus S.A.S
10.1.1. Company Overview
10.1.2. Financial Performance
10.1.3. SWOT Analysis
10.2. Aviation Industry Corporation of China Ltd. (AVIC)
10.2.1. Company Overview
10.2.2. Financial Performance
10.2.3. SWOT Analysis
10.3. Astronics Corporation
10.3.1. Company Overview
10.3.2. Financial Performance
10.3.3. SWOT Analysis
10.4. Boeing
10.4.1. Company Overview
10.4.2. Financial Performance
10.4.3. SWOT Analysis
10.5. Ball Corporation
10.5.1. Company Overview
10.5.2. Financial Performance
10.5.3. SWOT Analysis
10.6. BAE Systems
10.6.1. Company Overview
10.6.2. Financial Performance
10.6.3. SWOT Analysis
10.7. Cobham plc
10.7.1. Company Overview
10.7.2. Financial Performance
10.7.3. SWOT Analysis
10.8. Curtiss Wright
10.8.1. Company Overview
10.8.2. Financial Performance
10.8.3. SWOT Analysis
10.9. Elbit System
10.9.1. Company Overview
10.9.2. Financial Performance
10.9.3. SWOT Analysis
10.10. Gramin Ltd
10.10.1. Company Overview
10.10.2. Financial Performance
10.10.3. SWOT Analysis
10.11. GE Aviation
10.11.1. Company Overview
10.11.2. Financial Performance
10.11.3. SWOT Analysis
10.12. Harris Corporation
10.12.1. Company Overview
10.12.2. Financial Performance
10.12.3. SWOT Analysis
10.13. Honeywell International Inc.
10.13.1. Company Overview
10.13.2. Financial Performance
10.13.3. SWOT Analysis
10.14. Lockheed Martin Corporation
10.14.1. Company Overview
10.14.2. Financial Performance
10.14.3. SWOT Analysis
10.15. L3 Harris Corporation
10.15.1. Company Overview
10.15.2. Financial Performance
10.15.3. SWOT Analysis
10.16. Meggitt PLC
10.16.1. Company Overview
10.16.2. Financial Performance
10.16.3. SWOT Analysis
10.17. Northrop Grumman Corporation
10.17.1. Company Overview
10.17.2. Financial Performance
10.17.3. SWOT Analysis
10.18. Nucon Aerospace
10.18.1. Company Overview
10.18.2. Financial Performance
10.18.3. SWOT Analysis
10.19. Panasonic Corporation
10.19.1. Company Overview
10.19.2. Financial Performance
10.19.3. SWOT Analysis
10.20. Rolls Royce
10.20.1. Company Overview
10.20.2. Financial Performance
10.20.3. SWOT Analysis
10.21. Raytheon Company
10.21.1. Company Overview
10.21.2. Financial Performance
10.21.3. SWOT Analysis
10.22. Saab AB
10.22.1. Company Overview
10.22.2. Financial Performance
10.22.3. SWOT Analysis
10.23. Safran
10.23.1. Company Overview
10.23.2. Financial Performance
10.23.3. SWOT Analysis
10.24. Thales Group
10.24.1. Company Overview
10.24.2. Financial Performance
10.24.3. SWOT Analysis
10.25. Teledyne Technologies Inc.
10.25.1. Company Overview
10.25.2. Financial Performance
10.25.3. SWOT Analysis
10.26. Transdigm Group Inc.
10.26.1. Company Overview
10.26.2. Financial Performance
10.26.3. SWOT Analysis
PURCHASE OPTIONS
20% Free Customization ON ALL PURCHASE
*Terms & Conditions Apply
Looking for report on this market in a particular region or country? Get In Touch
Request Free Sample
Please fill in the form below to Request for free Sample Report
-
Office Hours Mon - Sat 10:00 - 16:00
-
Call Us +91 6201075429
-
Send Us Mail sales@marketdecipher.com
Market Decipher is a market research and consultancy firm involved in provision of market reports to organisations of varied sizes; small, large and medium.

© 2018 Market Decipher. All Rights Reserved