Position sensors market
By Technology (Linear, Photoelectric, Rotatory, and Proximity), By Application (Military and aerospace, Packaging, Automotive, Electronics, and Semiconductors), By Region (North America, Europe, APAC, and Rest of the World)
- Report ID : MD1063 |
- Pages : 152 |
- Tables : 92 |
- Formats :


Position Sensors market revenue shall reach a value of $7.01 Billion in 2026, growing with a CAGR of 6.34% during the forecast period of 2018 to 2026. In terms of volume sales, the market is anticipated to reach XX Units.
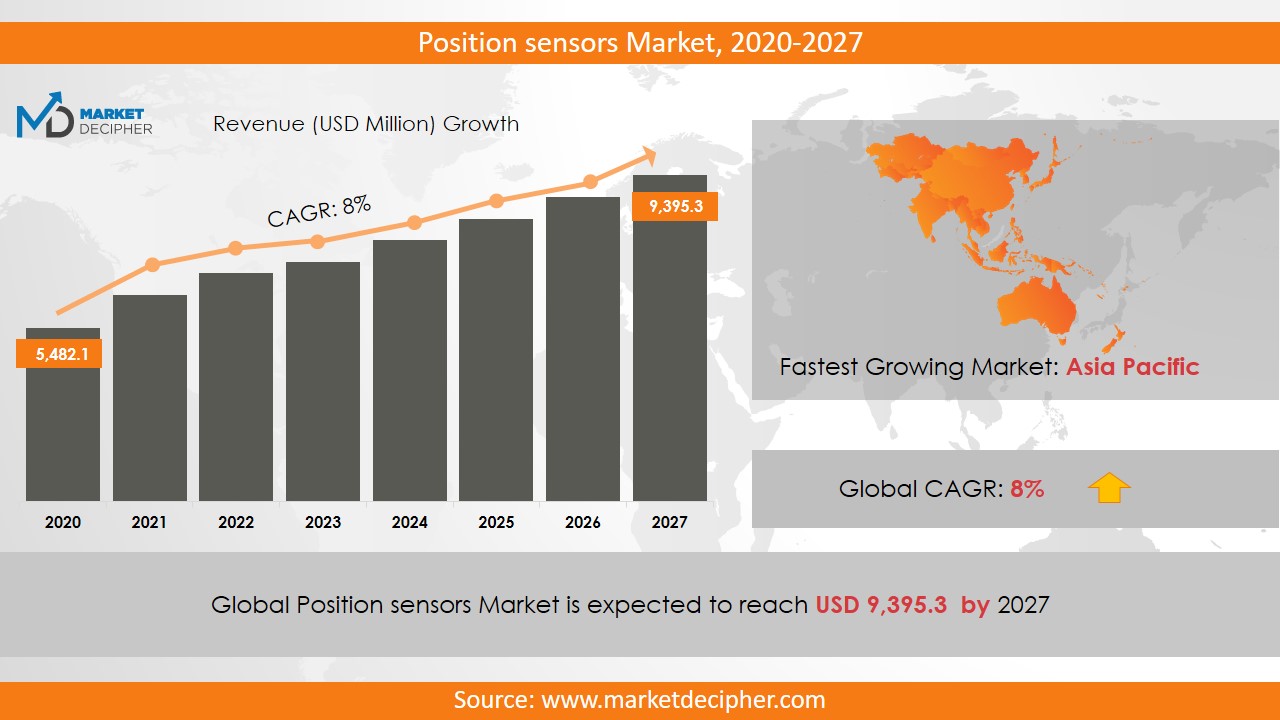
A position sensor is used to get the approximate position of any device. The obtained measurement of the position of the device can be accurate or relative. The position sensors market is anticipated to witness a significant growth over the forecast period owing to the ongoing technological advancements and enhancements in these sensors. Various manufacturers are working hard to improve the efficiency of the position sensors so that they can provide more accurate position measurements. Further, the rising demand for installing the advanced control system in machines in the manufacturing industry is anticipated to increase position sensors market sales.
There is a high demand for time-proven position sensing technology and highly advanced solutions in the military and aerospace sector. Moreover, the rising demand for automation and manufacturing industries is going to propel the position sensors market size. However, the factors such as the cyclic nature of semiconductors and the high cost of the raw materials are likely to hamper the growth of the position sensors market growth. Increasing the adoption of advanced technologies search in navigation and the GPS enabled devices are expected to drive the position sensors market share positively in the forecast period.
REGIONAL ANALYSIS
The Asia Pacific region has contributed substantially in 2018 owing to the increasing investment in the market by the semiconductor industries. Moreover, this region generated the highest revenue in recent years. After the Asia Pacific region, North America and Europe region have contributed significantly to the growth of the market revenue in 2018 and are expected to continue the same trend over the forecast period.
SEGMENT ANALYSIS
In terms of type, the position sensors market research report provides an in-depth analysis of linear, photoelectric, rotatory and proximity. Out of which, the proximity sensor has registered to account for about 25% of the total shares of the market. Proximity sensors have become an integral part of the many industries because they automate the process of providing information to administrators. During the forecast period the photoelectric sensor segment is expected to grow rapidly. These sensors are used extensively in the manufacturing industries, where there is a huge demand for sensor-based data.
On the basis of application, the segmentation has been done as military and aerospace, packaging, automotive, electronics, and semiconductors. The automotive segment has contributed to more than 45% of the total revenue of the market. Due to the increasing need for automatic gear selection, in the coming years from sensing and throttle controlling these sensors, their broad application is expected in motor vehicles. In addition, the growing demand for high-speed machines in manufacturing industries is expected to provide new ways for increasing the revenue of the market. With the increasing demand for advanced wearable devices with navigation and GPS, the market is expected to accelerate in terms of revenue over the forecast period.
INDUSTRY PLAYER ANALYSIS
Major industry players have been analyzed with coverage on their operating areas, revenues, and other strategic aspects. These industry players include Sensata Technologies, Sick AG, Heidenhain, Honeywell International Incorporated, Vishay Inter technology Incorporated, Bourns Incorporated, Infineon technologies AG, Panasonic Corporation, Allegro Microsystems, ST Microelectronics N.V, and T.E Connectivity Limited. Various industry players are adopting Highway plant business strategies in order to increase position sensors business size across the world. Other industries in this domain that are growing at a high CAGR include Aircraft Tank Sensors Fuel Market and Aircraft EGT Sensors Market.
COVERAGE HIGHLIGHTS
• Revenue Estimation and Forecast (2018 – 2026)
• Production Estimation and Forecast (2018 – 2026)
• Sales/Consumption Volume Estimation and Forecast (2018 – 2026)
• Breakdown of Revenue by Segments (2018 – 2026)
• Breakdown of Production by Segments (2018 – 2026)
• Breakdown of Sales Volume by Segments (2018 – 2026)
• Gross Margin and Profitability Analysis of Companies
• Business Trend and Expansion Analysis
• Import and Export Analysis
• Regional Analysis and Data Breakdown
SEGMENTAL ANALYSIS
By Technology Outlook ($Revenue and Unit Sales Volume, 2018-2026)
• Linear
• Photoelectric
• Rotatory
• Proximity
By End-Use Outlook ($Revenue and Unit Sales Volume, 2018-2026)
• Military and Aerospace
• Packaging
• Automotive
• Electronics
• Semiconductors
By Regional Outlook ($Revenue and Unit Sales Volume, 2018-2026)
• North America
• Canada
• U.S
• Mexico
• Europe
• Germany
• France
• U.K
• Rest of Europe
• Asia-Pacific
• China
• India
• Japan
• Rest of Asia Pacific
• Rest of the World
• Middle East
• Africa
• Latin America
CHAPTER 1. INTRODUCTION
1.1. RESEARCH METHODOLOGY
1.1.1. Data Collection
1.1.2. Data Modeling
1.1.3. Historical Revenue and Sales Estimation
1.1.4. Data Triangulation
1.2. RESEARCH PROCESS
1.2.1. Primary Research
1.2.2. Secondary Research
1.2.3. Survey Data
1.2.4. Validation by In-House Expert
1.3. POSITION SENSORS MARKET OVERVIEW
1.3.1. Research Scope and Market Definition
1.3.2. Executive Summary
CHAPTER 2. GLOBAL POSITION SENSORS MARKET DEMAND SIDE ANALYSIS
2.1. POSITION SENSORS MARKET CONSUMPTION VOLUME (BILLION UNITS), 2018 – 2025
2.2. MARKET CONSUMPTION VOLUME SPLIT BY REGION (BILLION UNITS), 2018 – 2025
2.3. MARKET CONSUMPTION VOLUME SPLIT BY COUNTRIES (BILLION UNITS), 2018 – 2025
2.4. MARKET REVENUE (BILLION USD), 2018-2025
2.5. MARKET REVENUE SPLIT BY REGION (BILLION UNITS), 2018 – 2025
2.6. POSITION SENSORS MARKET REVENUE SPLIT BY COUNTRIES (BILLION UNITS), 2018 – 2025
CHAPTER 3. GLOBAL POSITION SENSORS MARKET SUPPLY SIDE ANALYSIS
3.1. POSITION SENSORS MARKET PRODUCTION VOLUME (BILLION UNITS), 2018 – 2025
3.2. MARKET PRODUCTION VOLUME SPLIT BY REGION (BILLION UNITS), 2018-2025
3.3. MARKET PRODUCTION VOLUME SPLIT/RANKING BY COUNTRIES (BILLION UNITS), 2018 – 2025
CHAPTER 4. GLOBAL POSITION SENSORS MARKET COMPETITIVE SCENARIO & BUSINESS OPPORTUNITY ANALYSIS
4.1. COMPETITIVE STRENGTH RANKING BY MAJOR COUNTRIES, 2018
4.2. MARKET ATTRACTIVENESS RANKING BY MAJOR COUNTRIES, 2018 - 2025
4.3. EMERGING BUSINESS OPPORTUNITIES AND GROWTH PROSPECTS
4.3.1. Growth Drivers
4.3.2. Market Restraints
4.3.2. Opportunities
CHAPTER 5. GLOBAL POSITION SENSORS MARKET ENTRY STRATEGIES
5.1. ENTRY STRATEGIES IN DEVELOPING MARKETS
5.2. ENTRY STRATEGIES IN DEVELOPED MARKETS
CHAPTER 6. GLOBAL POSITION SENSORS MARKET BY TECHNOLOGY
6.1. SEGMENT OUTLINE
6.2. REVENUE SHARE BY TECHNOLOGY, $BILLION, 2018 – 2025
6.2. CONSUMPTION SHARE BY TECHNOLOGY, BILLION UNITS, 2018 - 2025
6.3. PRODUCTION SHARE BY TECHNOLOGY, BILLION UNITS, 2018 – 2025
6.4. LINEAR
6.4.1. Market determinants and trend analysis
6.4.2. Market revenue, sales and production volume, 2018 – 2025
6.5. PHOTOELECTRIC
6.5.1. Market determinants and trend analysis
6.5.2. Market revenue, sales and production volume, 2018 – 2025
6.6. ROTATORY
6.6.1. Market determinants and trend analysis
6.6.2. Market revenue, sales and production volume, 2018 – 2025
6.7. PROXIMITY
6.7.1. Market determinants and trend analysis
6.7.2. Market revenue, sales and production volume, 2018 – 2025
CHAPTER 7. GLOBAL POSITION SENSORS MARKET BY END-USE
7.1. SEGMENT OUTLINE
7.2. REVENUE SHARE BY END-USE, $BILLION, 2018 – 2025
7.2. CONSUMPTION SHARE BY END-USE, BILLION UNITS, 2018 - 2025
7.3. PRODUCTION SHARE BY END-USE, BILLION UNITS, 2018 – 2025
7.4. MILITARY AND AEROSPACE
7.4.1. Market determinants and trend analysis
7.4.2. Market revenue, sales and production volume, 2018 – 2025
7.5. PACKAGING
7.5.1. Market determinants and trend analysis
7.5.2. Market revenue, sales and production volume, 2018 – 2025
7.6. AUTOMOTIVE
7.6.1. Market determinants and trend analysis
7.6.2. Market revenue, sales and production volume, 2018 – 2025
7.7. ELECTRONICS
7.7.1. Market determinants and trend analysis
7.7.2. Market revenue, sales and production volume, 2018 – 2025
7.8. SEMICONDUCTORS
7.8.1. Market determinants and trend analysis
7.8.2. Market revenue, sales and production volume, 2018 – 2025
CHAPTER 8. GLOBAL POSITION SENSORS MARKET BY REGIONS
8.1. REGIONAL OUTLOOK
8.2. MARKET PRODUCTION, CONSUMPTION & REVENUE BY REGION, 2018-2025
8.3. NORTH AMERICA
8.3.1. Current Trends and Future Prospects
8.3.2. North America market revenue, sales and production volume, 2018 – 2025
8.3.3.U.S.
8.3.3.1. Position Sensors Market Revenue $Billion (2018 – 2025)
8.3.3.2. Position Sensors Market Consumption Billion Units (2018 – 2025)
8.3.3.3. Position Sensors Market Production Billion Units (2018 – 2025)
8.3.4. Canada
8.3.4.1. Position Sensors Market Revenue $Billion (2018 – 2025)
8.3.4.2. Position Sensors Market Consumption Billion Units (2018 – 2025)
8.3.4.3. Position Sensors Market Production Billion Units (2018 – 2025)
8.3.5. Mexico
8.3.5.1. Position Sensors Market Revenue $Billion (2018 – 2025)
8.3.5.2. Position Sensors Market Consumption Billion Units (2018 – 2025)
8.3.5.3. Position Sensors Market Production Billion Units (2018 – 2025)
8.4. EUROPE
8.4.1. Current Trends and Future Prospects
8.4.2. Europe market revenue, sales and production volume, 2018 – 2025
8.4.3. U.K
8.4.3.1. Position Sensors Market Revenue $Billion (2018 – 2025)
8.4.3.2. Position Sensors Market Consumption Billion Units (2018 – 2025)
8.4.3.3. Position Sensors Market Production Billion Units (2018 – 2025)
8.4.4. Germany
8.4.4.1. Position Sensors Market Revenue $Billion (2018 – 2025)
8.4.4.2. Position Sensors Market Consumption Billion Units (2018 – 2025)
8.4.4.3. Position Sensors Market Production Billion Units (2018 – 2025)
8.4.5. France
8.4.5.1. Position Sensors Market Revenue $Billion (2018 – 2025)
8.4.5.2. Position Sensors Market Consumption Billion Units (2018 – 2025)
8.4.5.3. Position Sensors Market Production Billion Units (2018 – 2025)
8.4.6. Italy
8.4.6.1. Position Sensors Market Revenue $Billion (2018 – 2025)
8.4.6.2. Position Sensors Market Consumption Billion Units (2018 – 2025)
8.4.6.3. Position Sensors Market Production Billion Units (2018 – 2025)
8.4.7. Rest of Europe
8.4.7.1. Position Sensors Market Revenue $Billion (2018 – 2025)
8.4.7.2. Position Sensors Market Consumption Billion Units (2018 – 2025)
8.4.7.3. Position Sensors Market Production Billion Units (2018 – 2025)
8.5. ASIA PACIFIC
8.5.1. Current Trends and Future Prospects
8.5.2. Europe market revenue, sales and production volume, 2018 – 2025
8.5.3. India
8.5.3.1. Position Sensors Market Revenue $Billion (2018 – 2025)
8.5.3.2. Position Sensors Market Consumption Billion Units (2018 – 2025)
8.5.3.3. Position Sensors Market Production Billion Units (2018 – 2025)
8.5.4. Japan
8.5.4.1. Position Sensors Market Revenue $Billion (2018 – 2025)
8.5.4.2. Position Sensors Market Consumption Billion Units (2018 – 2025)
8.5.4.3. Position Sensors Market Production Billion Units (2018 – 2025)
8.5.5. China
8.5.5.1. Position Sensors Market Revenue $Billion (2018 – 2025)
8.5.5.2. Position Sensors Market Consumption Billion Units (2018 – 2025)
8.5.5.3. Position Sensors Market Production Billion Units (2018 – 2025)
8.5.6. South Korea
8.5.6.1. Position Sensors Market Revenue $Billion (2018 – 2025)
8.5.6.2. Position Sensors Market Consumption Billion Units (2018 – 2025)
8.5.6.3. Position Sensors Market Production Billion Units (2018 – 2025)
8.5.7. Rest of APAC
8.5.7.1. Position Sensors Market Revenue $Billion (2018 – 2025)
8.5.7.2. Position Sensors Market Consumption Billion Units (2018 – 2025)
8.5.7.3. Position Sensors Market Production Billion Units (2018 – 2025)
8.6. REST OF THE WORLD
8.6.1. Current Trends and Future Prospects
8.6.2. Europe market revenue, sales and production volume, 2018 – 2025
8.6.3. Latin America
8.6.3.1. Position Sensors Market Revenue $Billion (2018 – 2025)
8.6.3.2. Position Sensors Market Consumption Billion Units (2018 – 2025)
8.6.3.3. Position Sensors Market Production Billion Units (2018 – 2025)
8.6.4. Middle East
8.6.4.1. Position Sensors Market Revenue $Billion (2018 – 2025)
8.6.4.2. Position Sensors Market Consumption Billion Units (2018 – 2025)
8.6.4.3. Position Sensors Market Production Billion Units (2018 – 2025)
8.6.5. Africa
8.6.5.1. Position Sensors Market Revenue $Billion (2018 – 2025)
8.6.5.2. Position Sensors Market Consumption Billion Units (2018 – 2025)
8.6.5.3. Position Sensors Market Production Billion Units (2018 – 2025)
CHAPTER 9. KEY VENDOR PROFILES
9.1. Sensata Technologies
9.1.1. Company overview
9.1.2. Portfolio Analysis
9.1.3. Estimated revenue from position sensors business and market share
9.1.4. Regional & business segment Revenue Analysis
9.2. Sick AG
9.2.1. Company overview
9.2.2. Portfolio Analysis
9.2.3. Estimated revenue from position sensors business and market share
9.2.4. Regional & business segment Revenue Analysis
9.3. Heidenhain
9.3.1. Company overview
9.3.2. Portfolio Analysis
9.3.3. Estimated revenue from position sensors business and market share
9.3.4. Regional & business segment Revenue Analysis
9.4. Honeywell International Incorporated
9.4.1. Company overview
9.4.2. Portfolio Analysis
9.4.3. Estimated revenue from position sensors business and market share
9.4.4. Regional & business segment Revenue Analysis
9.5. Vishay Inter technology Incorporated
9.5.1. Company overview
9.5.2. Portfolio Analysis
9.5.3. Estimated revenue from position sensors business and market share
9.5.4. Regional & business segment Revenue Analysis
9.6. Bourns Incorporated
9.6.1. Company overview
9.6.2. Portfolio Analysis
9.6.3. Estimated revenue from position sensors business and market share
9.6.4. Regional & business segment Revenue Analysis
9.7. technologies AG
9.7.1. Company overview
9.7.2. Portfolio Analysis
9.7.3. Estimated revenue from position sensors business and market share
9.7.4. Regional & business segment Revenue Analysis
9.8. Panasonic Corporation
9.8.1. Company overview
9.8.2. Portfolio Analysis
9.8.3. Estimated revenue from position sensors business and market share
9.8.4. Regional & business segment Revenue Analysis
9.9. Allegromicrosystems
9.9.1. Company overview
9.9.2. Portfolio Analysis
9.9.3. Estimated revenue from position sensors business and market share
9.9.4. Regional & business segment Revenue Analysis
9.10. ST Microelectronics N.V
9.10.1. Company overview
9.10.2. Portfolio Analysis
9.10.3. Estimated revenue from position sensors business and market share
9.10.4. Regional & business segment Revenue Analysis
9.11. T.E Connectivity Limited
9.11.1. Company overview
9.11.2. Portfolio Analysis
9.11.3. Estimated revenue from position sensors business and market share
9.11.4. Regional & business segment Revenue Analysis
PURCHASE OPTIONS
20% Free Customization ON ALL PURCHASE
*Terms & Conditions Apply
Looking for report on this market in a particular region or country? Get In Touch
Request Free Sample
Please fill in the form below to Request for free Sample Report
-
Office Hours Mon - Sat 10:00 - 16:00
-
Call Us +91 6201075429
-
Send Us Mail sales@marketdecipher.com
Market Decipher is a market research and consultancy firm involved in provision of market reports to organisations of varied sizes; small, large and medium.

© 2018 Market Decipher. All Rights Reserved