Security and Vulnerability Management Market Revenue& Trend Forecast Report, 2019-2026
By Service (Support, consulting and Intergradation), By Solution (Forensic and incident investigation, Policy and compliance, Security information and event management, Application vulnerability assessment and Device vulnerability assessment), By Organisation size (Small, Medium and Large Enterprises), By Industry Verticals (Telecom, Banking, Healthcare, Aerospace and defence, Information technology, Financial Services, Insurance, Retail and others), By Region(North America, Europe, APAC and Rest of the World)
- Report ID : MD1106 |
- Pages : 198 |
- Tables : 89 |
- Formats :


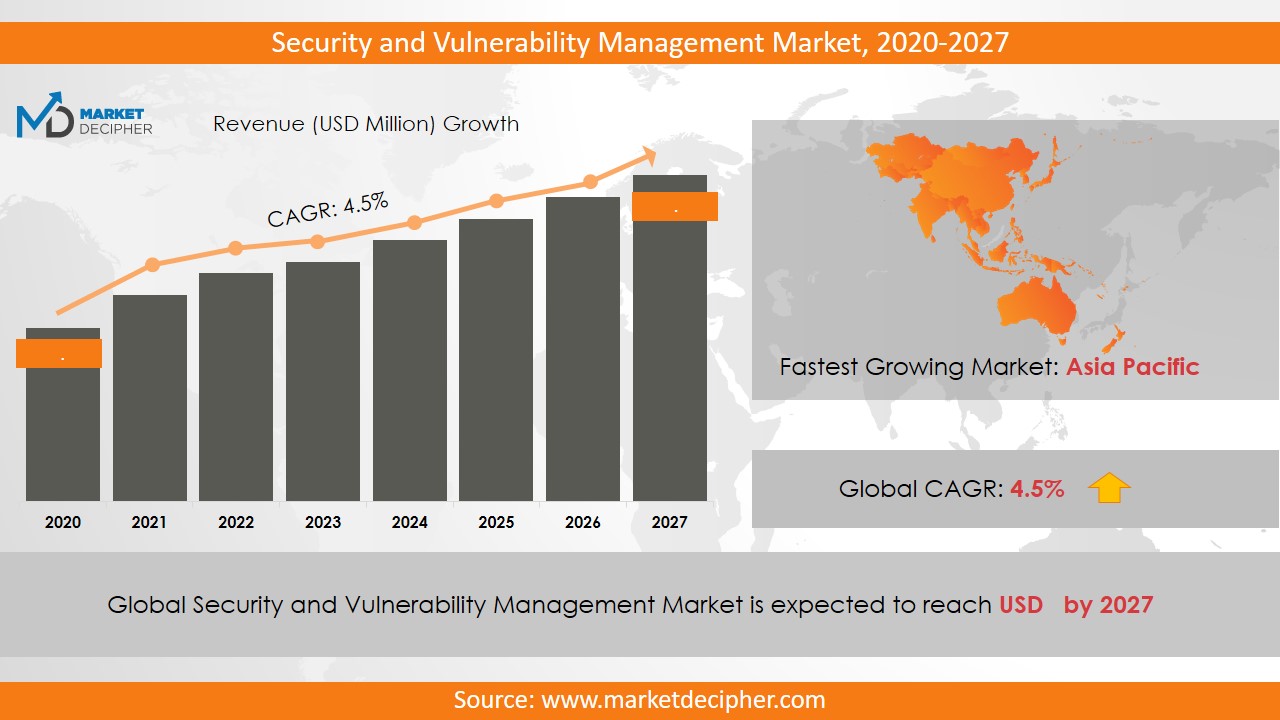
The market revenue of Security and Vulnerability Management shall reach a value of $XX Million in 2026, growing with a CAGR of XX.X% during the forecast period of 2018 to 2026.
Security and vulnerability management means identification, classification and eliminating the major vulnerabilities in any networking hardware or software. As the incidents of cyber crimes, hacking and data loss or data theft are increasing tremendously since the last few years there is a high demand for security and vulnerability management among various organizations and thus the security and vulnerability management market is estimated to grow at the highest rate over the forecast period. Further, the increasing sophistication in network security due to the high adoption of technologies such as cloud computing and big data various technological advancements are responsible for increasing the security and vulnerability management market size. The organizations are facing several cyber threats nowadays such as phishing, attacks based on the web, social attacks and other malicious software which are driving the security and vulnerability management market share considerably.
The introduction of e-commerce has increased the number of cyber fraud cases as well as theft incidents which are anticipated to boost up the demand for strict security measures. Comprehensive application of the security and vulnerability management in various sectors such as financial services, BFSI, and healthcare for increasing the standards of security is driving the security and vulnerability management market growth. Nowadays, the trend of BYOD (Bring Your Device) is increasing rapidly among industries which augment the market revenue. However, a major challenge for the security and vulnerability management market is to establish its dominance across the globe even though many efficient substitute management solutions are present.
REGIONAL ANALYSIS
The North America region is the dominant region for contributing to the largest revenue of the overall market revenue owing to the technological advancements and rising security concerns in the region. Due to the increased penetration of smartphones and the adoption of efficient solutions in North America, data recovery in the industries has become more efficient. Further, the region is anticipated to grow tremendously over the forecast period. The Asia Pacific region is contributing substantially to market growth. Moreover, the developing economies such as India, China, and Japan are supporting the augmentation of the market due to the on going technological advancements in the region. In India, the stringency of rules and policies imposed by the government is estimated to increase market growth to a significant level.
SEGMENT ANALYSIS
In terms of solution, the security and vulnerability management market provide a keen analysis of forensic and incident investigation, policy and compliance, security information and event management, application vulnerability assessment and device vulnerability assessment. Based on services, the market has been segmented as support, consulting and intergradation.
Based on organization size, the market has been segmented as small, medium and large enterprises. Major end-user industries are telecom, banking, healthcare, aerospace and defense, information technology, financial services, insurance, retail, and others. Out of which the BFSI sector dominated the market share.
INDUSTRY PLAYER ANALYSIS
Major industry players have been analyzed with coverage on their operating areas, revenues, and other strategic aspects. These industry players include Tripwire Incorporated, IBM Corporation, EMC Corporation, Skybox security Incorporated, Qualys Incorporated, McAfee Incorporated, Symantec Corporation, Ailen Vault Incorporated, and NetIQ Corporation. IBM launched a fully integrated Wavelength Division Multiplexing (WDM) Si photonics chip for Big Data and cloud services in 2017. It enables the consumers to download the entire HD digital movie within a fraction of seconds. Other industries in this domain that are growing at a high CAGR include Bring Your Own Device Security Market and Document Capture Software Market.
COVERAGE HIGHLIGHTS
• Revenue Estimation and Forecast (2018 – 2026)
• Sales Estimation and Forecast (2018 – 2026)
• Breakdown of Revenue by Segments (2018 – 2026)
• Breakdown of Sales by Segments (2018 – 2026)
• Gross Margin and Profitability Analysis of Companies
• Business Trend and Expansion Analysis
• Regional Analysis and Data Breakdown
SEGMENTAL ANALYSIS
By Solution Outlook ($Revenue,2018-2026)
• Forensic and Incident Investigation
• Policy and Compliance
• Security Information and Event Management
• Application Vulnerability Assessment
• Device Vulnerability Assessment
By Service Outlook ($Revenue,2018-2026)
• Support
• Consulting
• Inter gradation
By organization Size Outlook ($Revenue, 2018-2026)
· Small enterprises
· Medium enterprises
· Large enterprises
By Industry verticals Outlook ($Revenue, 2018-2026)
· Telecom
· Banking
· Healthcare
· Aerospace and defense
· Information technology
· Financial services
· Insurance
· Retail
· Others
By Regional Outlook ($Revenue and Unit Sales, 2018-2026)
• North America
• Canada
• U.S
• Mexico
• Europe
• Germany
• U.K
• France
• Netherlands
• Austria
• Rest of Europe
• Asia-Pacific
• China
• India
• Japan
• South Korea
• Australia
• Rest of Asia Pacific
• The Middle East and Africa
• Saudi Arabia
• United Arab Emirates
• Rest of Middle East
• Africa
• South America
• Brazil
• Argentina
• Rest of South America
INDUSTRY PLAYERS ANALYSIS
• Tripwire Incorporated
• IBM Corporation
• EMC Corporation
• Skybox security Incorporated
• Qualys Incorporated
• McAfee Incorporated
• Symantec Corporation
• Ailen Vault Incorporated
• NetIQ Corporation
CHAPTER 1. INTRODUCTION
1.1. RESEARCH METHODOLOGY
1.1.1. Data Collection
1.1.2. Data Modeling
1.1.3. Historical Revenue and Sales Estimation
1.1.4. Data Triangulation
1.2. RESEARCH PROCESS
1.2.1. Primary Research
1.2.2. Secondary Research
1.2.3. Survey Data
1.2.4. Validation by In-House Expert
1.3. SECURITY AND VULNERABILITY MANAGEMENT MARKET OVERVIEW
1.3.1. Research Scope and Market Definition
1.3.2. Executive Summary
CHAPTER 2. GLOBAL SECURITY AND VULNERABILITY MANAGEMENT MARKET DEMAND SIDE ANALYSIS
2.1. SECURITY AND VULNERABILITY MANAGEMENT MARKET CONSUMPTION VOLUME (MILLION UNITS), 2018 – 2025
2.2. MARKET CONSUMPTION VOLUME SPLIT BY REGION (MILLION UNITS), 2018 – 2025
2.3. MARKET CONSUMPTION VOLUME SPLIT BY COUNTRIES (MILLION UNITS), 2018 – 2025
2.4. MARKET REVENUE (MILLION USD), 2018-2025
2.5. MARKET REVENUE SPLIT BY REGION (MILLION UNITS), 2018 – 2025
2.6. SECURITY AND VULNERABILITY MANAGEMENT MARKET REVENUE SPLIT BY COUNTRIES (MILLION UNITS), 2018 – 2025
CHAPTER 3. GLOBAL SECURITY AND VULNERABILITY MANAGEMENT MARKET SUPPLY SIDE ANALYSIS
3.1. SECURITY AND VULNERABILITY MANAGEMENT MARKET PRODUCTION VOLUME (MILLION UNITS), 2018 – 2025
3.2. MARKET PRODUCTION VOLUME SPLIT BY REGION (MILLION UNITS), 2018-2025
3.3. MARKET PRODUCTION VOLUME SPLIT/RANKING BY COUNTRIES (MILLION UNITS), 2018 – 2025
CHAPTER 4. GLOBAL SECURITY AND VULNERABILITY MANAGEMENT MARKET COMPETITIVE SCENARIO & BUSINESS OPPORTUNITY ANALYSIS
4.1. COMPETITIVE STRENGTH RANKING BY MAJOR COUNTRIES, 2018
4.2. MARKET ATTRACTIVENESS RANKING BY MAJOR COUNTRIES, 2018 - 2025
4.3. EMERGING BUSINESS OPPORTUNITIES AND GROWTH PROSPECTS
4.3.1. Growth Drivers
4.3.2. Market Restraints
4.3.2. Opportunities
CHAPTER 5. GLOBAL SECURITY AND VULNERABILITY MANAGEMENT MARKET ENTRY STRATEGIES
5.1. ENTRY STRATEGIES IN DEVELOPING MARKETS
5.2. ENTRY STRATEGIES IN DEVELOPED MARKETS
CHAPTER 6. GLOBAL SECURITY AND VULNERABILITY MANAGEMENT MARKET BY SOLUTION
6.1. SEGMENT OUTLINE
6.2. REVENUE SHARE BY SOLUTION, $MILLION, 2018 – 2025
6.2. CONSUMPTION SHARE BY SOLUTION, MILLION UNITS, 2018 - 2025
6.3. PRODUCTION SHARE BY SOLUTION, MILLION UNITS, 2018 – 2025
6.4. FORENSIC AND INCIDENT INVESTIGATION
6.4.1. Market determinants and trend analysis
6.4.2. Market revenue, sales and production volume, 2018 – 2025
6.5. POLICY AND COMPLIANCE
6.5.1. Market determinants and trend analysis
6.5.2. Market revenue, sales and production volume, 2018 – 2025
6.6. SECURITY INFORMATION AND EVENT MANAGEMENT
6.6.1. Market determinants and trend analysis
6.6.2. Market revenue, sales and production volume, 2018 – 2025
6.7. APPLICATION VULNERABILITY ASSESSMENT
6.7.1. Market determinants and trend analysis
6.7.2. Market revenue, sales and production volume, 2018 – 2025
6.8. DEVICE VULNERABILITY ASSESSMENT
6.8.1. Market determinants and trend analysis
6.8.2. Market revenue, sales and production volume, 2018 – 2025
CHAPTER 7. GLOBAL SECURITY AND VULNERABILITY MANAGEMENT MARKET BY SERVICE
7.1. SEGMENT OUTLINE
7.2. REVENUE SHARE BY SERVICE, $MILLION, 2018 – 2025
7.2. CONSUMPTION SHARE BY SERVICE, MILLION UNITS, 2018 - 2025
7.3. PRODUCTION SHARE BY SERVICE, MILLION UNITS, 2018 – 2025
7.4. SUPPORT
7.4.1. Market determinants and trend analysis
7.4.2. Market revenue, sales and production volume, 2018 – 2025
7.5. CONSULTING
7.5.1. Market determinants and trend analysis
7.5.2. Market revenue, sales and production volume, 2018 – 2025
7.6. INTER GRADATION
7.6.1. Market determinants and trend analysis
7.6.2. Market revenue, sales and production volume, 2018 – 2025
CHAPTER 8. GLOBAL SECURITY AND VULNERABILITY MANAGEMENT MARKET BY ORGANIZATION
8.1. SEGMENT OUTLINE
8.2. REVENUE SHARE BY ORGANIZATION, $MILLION, 2018 – 2025
8.2. CONSUMPTION SHARE BY ORGANIZATION, MILLION UNITS, 2018 - 2025
8.3. PRODUCTION SHARE BY ORGANIZATION, MILLION UNITS, 2018 – 2025
8.4. SMALL ENTERPRISES
8.4.1. Market determinants and trend analysis
8.4.2. Market revenue, sales and production volume, 2018 – 2025
8.5. MEDIUM ENTERPRISES
8.5.1. Market determinants and trend analysis
8.5.2. Market revenue, sales and production volume, 2018 – 2025
8.6. LARGE ENTERPRISES
8.6.1. Market determinants and trend analysis
8.6.2. Market revenue, sales and production volume, 2018 – 2025
CHAPTER 9. GLOBAL SECURITY AND VULNERABILITY MANAGEMENT MARKET BY INDUSTRY VERTICALS
9.1. SEGMENT OUTLINE
9.2. REVENUE SHARE BY INDUSTRY VERTICALS, $MILLION, 2018 – 2025
9.2. CONSUMPTION SHARE BY INDUSTRY VERTICALS, MILLION UNITS, 2018 - 2025
9.3. PRODUCTION SHARE BY INDUSTRY VERTICALS, MILLION UNITS, 2018 – 2025
9.4. TELECOM
9.4.1. Market determinants and trend analysis
9.4.2. Market revenue, sales and production volume, 2018 – 2025
9.5. BANKING
9.5.1. Market determinants and trend analysis
9.5.2. Market revenue, sales and production volume, 2018 – 2025
9.6. HEALTHCARE
9.6.1. Market determinants and trend analysis
9.6.2. Market revenue, sales and production volume, 2018 – 2025
9.7. AEROSPACE AND DEFENSE
9.7.1. Market determinants and trend analysis
9.7.2. Market revenue, sales and production volume, 2018 – 2025
9.8. INFORMATION TECHNOLOGY
9.8.1. Market determinants and trend analysis
9.8.2. Market revenue, sales and production volume, 2018 – 2025
9.9. FINANCIAL SERVICES
9.9.1. Market determinants and trend analysis
9.9.2. Market revenue, sales and production volume, 2018 – 2025
9.10. INSURANCE
9.10.1. Market determinants and trend analysis
9.10.2. Market revenue, sales and production volume, 2018 – 2025
9.11. RETAIL
9.11.1. Market determinants and trend analysis
9.11.2. Market revenue, sales and production volume, 2018 – 2025
9.12. OTHERS
9.12.1. Market determinants and trend analysis
9.12.2. Market revenue, sales and production volume, 2018 – 2025
CHAPTER 10. GLOBAL SECURITY AND VULNERABILITY MANAGEMENT MARKET BY REGIONS
10.1. REGIONAL OUTLOOK
10.2. MARKET PRODUCTION, CONSUMPTION & REVENUE BY REGION, 2018-2025
10.3. NORTH AMERICA
10.3.1. Current Trends and Future Prospects
10.3.2. North America market revenue, sales and production volume, 2018 – 2025
10.3.3.U.S.
10.3.3.1. Security and Vulnerability Management Market Revenue $Million (2018 – 2025)
10.3.3.2. Security and Vulnerability Management Market Consumption Million Units (2018 – 2025)
10.3.3.3. Security and Vulnerability Management Market Production Million Units (2018 – 2025)
10.3.4. Canada
10.3.4.1. Security and Vulnerability Management Market Revenue $Million (2018 – 2025)
10.3.4.2. Security and Vulnerability Management Market Consumption Million Units (2018 – 2025)
10.3.4.3. Security and Vulnerability Management Market Production Million Units (2018 – 2025)
10.3.5. Mexico
10.3.5.1. Security and Vulnerability Management Market Revenue $Million (2018 – 2025)
10.3.5.2. Security and Vulnerability Management Market Consumption Million Units (2018 – 2025)
10.3.5.3. Security and Vulnerability Management Market Production Million Units (2018 – 2025)
10.4. EUROPE
10.4.1. Current Trends and Future Prospects
10.4.2. Europe market revenue, sales and production volume, 2018 – 2025
10.4.3. U.K
10.4.3.1. Security and Vulnerability Management Market Revenue $Million (2018 – 2025)
10.4.3.2. Security and Vulnerability Management Market Consumption Million Units (2018 – 2025)
10.4.3.3. Security and Vulnerability Management Market Production Million Units (2018 – 2025)
10.4.4. Germany
10.4.4.1. Security and Vulnerability Management Market Revenue $Million (2018 – 2025)
10.4.4.2. Security and Vulnerability Management Market Consumption Million Units (2018 – 2025)
10.4.4.3. Security and Vulnerability Management Market Production Million Units (2018 – 2025)
10.4.5. France
10.4.5.1. Security and Vulnerability Management Market Revenue $Million (2018 – 2025)
10.4.5.2. Security and Vulnerability Management Market Consumption Million Units (2018 – 2025)
10.4.5.3. Security and Vulnerability Management Market Production Million Units (2018 – 2025)
10.4.6. Italy
10.4.6.1. Security and Vulnerability Management Market Revenue $Million (2018 – 2025)
10.4.6.2. Security and Vulnerability Management Market Consumption Million Units (2018 – 2025)
10.4.6.3. Security and Vulnerability Management Market Production Million Units (2018 – 2025)
10.4.7. Rest of Europe
10.4.7.1. Security and Vulnerability Management Market Revenue $Million (2018 – 2025)
10.4.7.2. Security and Vulnerability Management Market Consumption Million Units (2018 – 2025)
10.4.7.3. Security and Vulnerability Management Market Production Million Units (2018 – 2025)
10.5. ASIA PACIFIC
10.5.1. Current Trends and Future Prospects
10.5.2. Europe market revenue, sales and production volume, 2018 – 2025
10.5.3. India
10.5.3.1. Security and Vulnerability Management Market Revenue $Million (2018 – 2025)
10.5.3.2. Security and Vulnerability Management Market Consumption Million Units (2018 – 2025)
10.5.3.3. Security and Vulnerability Management Market Production Million Units (2018 – 2025)
10.5.4. Japan
10.5.4.1. Security and Vulnerability Management Market Revenue $Million (2018 – 2025)
10.5.4.2. Security and Vulnerability Management Market Consumption Million Units (2018 – 2025)
10.5.4.3. Security and Vulnerability Management Market Production Million Units (2018 – 2025)
10.5.5. China
10.5.5.1. Security and Vulnerability Management Market Revenue $Million (2018 – 2025)
10.5.5.2. Security and Vulnerability Management Market Consumption Million Units (2018 – 2025)
10.5.5.3. Security and Vulnerability Management Market Production Million Units (2018 – 2025)
10.5.6. South Korea
10.5.6.1. Security and Vulnerability Management Market Revenue $Million (2018 – 2025)
10.5.6.2. Security and Vulnerability Management Market Consumption Million Units (2018 – 2025)
10.5.6.3. Security and Vulnerability Management Market Production Million Units (2018 – 2025)
10.5.7. Rest of APAC
10.5.7.1. Security and Vulnerability Management Market Revenue $Million (2018 – 2025)
10.5.7.2. Security and Vulnerability Management Market Consumption Million Units (2018 – 2025)
10.5.7.3. Security and Vulnerability Management Market Production Million Units (2018 – 2025)
10.6. REST OF THE WORLD
10.6.1. Current Trends and Future Prospects
10.6.2. Europe market revenue, sales and production volume, 2018 – 2025
10.6.3. Latin America
10.6.3.1. Security and Vulnerability Management Market Revenue $Million (2018 – 2025)
10.6.3.2. Security and Vulnerability Management Market Consumption Million Units (2018 – 2025)
10.6.3.3. Security and Vulnerability Management Market Production Million Units (2018 – 2025)
10.6.4. Middle East
10.6.4.1. Security and Vulnerability Management Market Revenue $Million (2018 – 2025)
10.6.4.2. Security and Vulnerability Management Market Consumption Million Units (2018 – 2025)
10.6.4.3. Security and Vulnerability Management Market Production Million Units (2018 – 2025)
10.6.5. Africa
10.6.5.1. Security and Vulnerability Management Market Revenue $Million (2018 – 2025)
10.6.5.2. Security and Vulnerability Management Market Consumption Million Units (2018 – 2025)
10.6.5.3. Security and Vulnerability Management Market Production Million Units (2018 – 2025)
CHAPTER 11. KEY VENDOR PROFILES
11.1. Tripwire Incorporated
11.1.1. Company overview
11.1.2. Portfolio Analysis
11.1.3. Estimated revenue from security and vulnerability management business and market share
11.1.4. Regional & business segment Revenue Analysis
11.2. IBM Corporation
11.2.1. Company overview
11.2.2. Portfolio Analysis
11.2.3. Estimated revenue from security and vulnerability management business and market share
11.2.4. Regional & business segment Revenue Analysis
11.3. EMC corporation
11.3.1. Company overview
11.3.2. Portfolio Analysis
11.3.3. Estimated revenue from security and vulnerability management business and market share
11.3.4. Regional & business segment Revenue Analysis
11.4. Skybox security Incorporated
11.4.1. Company overview
11.4.2. Portfolio Analysis
11.4.3. Estimated revenue from security and vulnerability management business and market share
11.4.4. Regional & business segment Revenue Analysis
11.5. Qualys Incorporated
11.5.1. Company overview
11.5.2. Portfolio Analysis
11.5.3. Estimated revenue from security and vulnerability management business and market share
11.5.4. Regional & business segment Revenue Analysis
11.6. McAfee Incorporated
11.6.1. Company overview
11.6.2. Portfolio Analysis
11.6.3. Estimated revenue from security and vulnerability management business and market share
11.6.4. Regional & business segment Revenue Analysis
11.7. Symantec Corporation
11.7.1. Company overview
11.7.2. Portfolio Analysis
11.7.3. Estimated revenue from security and vulnerability management business and market share
11.7.4. Regional & business segment Revenue Analysis
11.8. Ailen Vault Incorporated
11.8.1. Company overview
11.8.2. Portfolio Analysis
11.8.3. Estimated revenue from security and vulnerability management business and market share
11.8.4. Regional & business segment Revenue Analysis
11.9. NetIQ Corporation
11.9.1. Company overview
11.9.2. Portfolio Analysis
11.9.3. Estimated revenue from security and vulnerability management business and market share
11.9.4. Regional & business segment Revenue Analysis
PURCHASE OPTIONS
20% Free Customization ON ALL PURCHASE
*Terms & Conditions Apply
Looking for report on this market in a particular region or country? Get In Touch
Request Free Sample
Please fill in the form below to Request for free Sample Report
-
Office Hours Mon - Sat 10:00 - 16:00
-
Call Us +91 6201075429
-
Send Us Mail sales@marketdecipher.com
Market Decipher is a market research and consultancy firm involved in provision of market reports to organisations of varied sizes; small, large and medium.

© 2018 Market Decipher. All Rights Reserved