Smart TV Market Revenue, Sales Volume & Trend Forecasts Report, 2019-2026
By Resolution (4K UHD, 8K TV, FULL HD, and HD TV), By Screen Size (Below 32 Inches, 32 To 45 Inches, 46 To 55 Inches, 56 To 65 Inches, and Above 65 Inches), By Screen Type (Flat, and Curved), By Region (North America, Europe, APAC and Rest Of The World)
- Report ID : MD1004 |
- Pages : 185 |
- Tables : 78 |
- Formats :


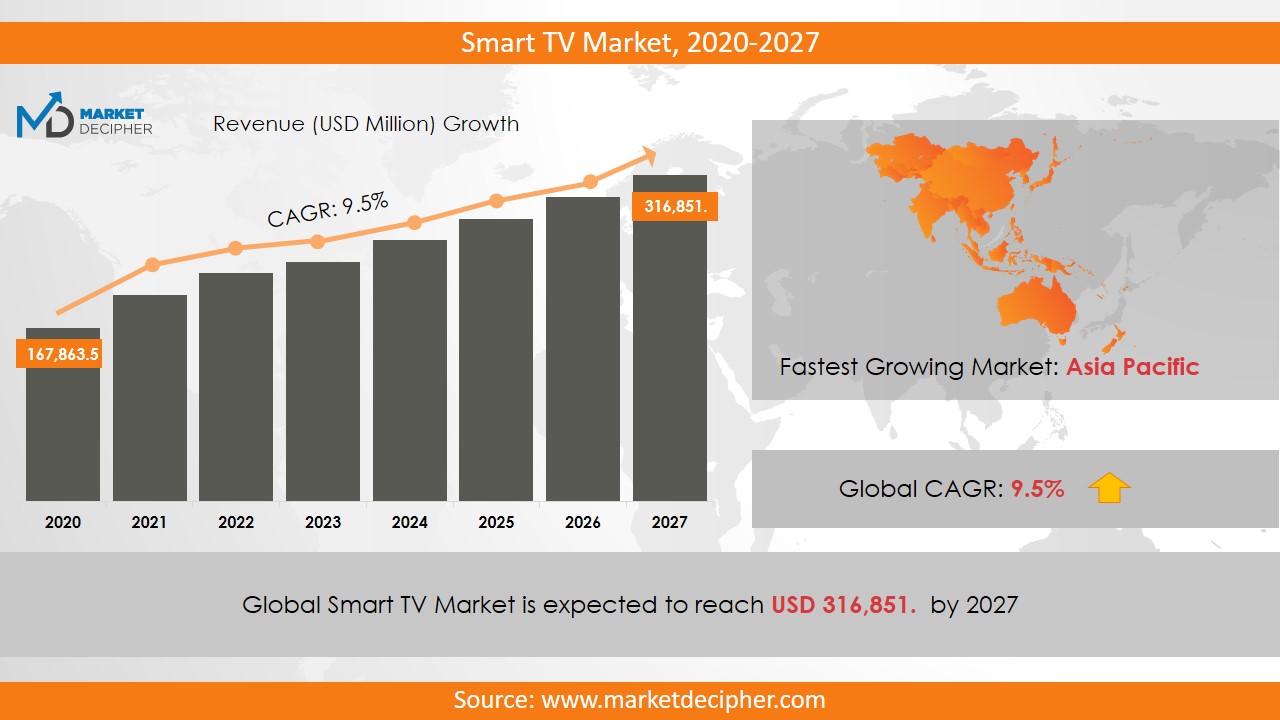
Smart TV market revenue shall reach a value of $298 Billion in 2026, growing with a CAGR of 10.2% during the forecast period of 2019 to 2026. In terms of volume sales, the market is anticipated to reach XX Units.
The smart TV supports Internet services and provides interactive features like online streaming, recording and storage facilities. Owing to the increase in the income of consumers, their lifestyle has improved tremendously and the demand for internet services has increased. Due to all these reasons, some manufacturers are developing their operating system and therefore due to the emergence of popular industry players such as Hisense Corporation Limited and TCL Corporation, Smart TV is being accepted quite easily in China. This TV is also used for advertising purposes and makes revenues largely from them. Although, due to the security and privacy concerns of organizations, the market revenue may fall.
Smart TV consumers are increasing due to the growing trend of video streaming media. The increasing popularity of smart TVs has affected the cable TV market as well as set-top-box and traditional television platforms to a great extent. On the other hand, the increasing demand for online streaming has provided service providers the opportunity to enter the top (OTT) location and distribute content through the Internet.
REGIONAL ANALYSIS
In 2018, due to the growing demand for media streaming devices, the market revenue of the Asia Pacific region has increased significantly. India has made significant contributions to the market growth. After India entered the Smart TV segment in 2018, Xiaomi has increased its deliveries rapidly. The flat display segment has made a great contribution to driving smart TV market shares in 2018. Asia- Pacific region has made the largest contribution to this market in terms of shares & revenue.
SEGMENT ANALYSIS
In terms of resolution, the smart TV display market report provides a detailed analysis of 4K UHD TV, 8K TV, Full HD TV, and HD TV. They come in different sizes such as Below 32 inches, 32 to 45 inches, 46 to 55 inches, 56 to 65 inches, and Above 65 inches. The 46-55 inches segment is anticipated to contribute significantly to the market growth. By Screen type, the segmentation has been done as flat and curved. The establishment of 4K technology has brought changes in the screen size preferences of consumers. Due to attractive pricing and features, the interest of the consumer is slowly moving towards a larger display screen.
The flat display segment established its dominance over the industry in 2018 and its income was estimated to be more than $127 billion. The trend can be attributed to the high cost of curved panels. Viewers prefer a flat screen rather than a curved screen. Apart from this, the curvature of the latter makes it difficult to mount the TV on the wall. However, the market players are more focused to develop curved displays as they reduce image erosion because viewing angles facilitates viewing the image. Apart from this, vendors have also introduced flexible TVs that can serve curved as well as flat panel displays.
MARKET PLAYER ANALYSIS
Major market players have been analyzed with coverage on their operating areas, revenues, and other strategic aspects. These market players include LG Electronics, Panasonic Corporation, Samsung Electronics Corporation Limited, Sony Corporation, Videocon Industries Limited, Hisense Group, Haier Electronics Group Corporation Limited, Micromax Informatics, and Sansui Electric Corporation. Other industries in this domain that is growing at a high CAGR include TV Advertisement Software Market and 4K TV Market.
COVERAGE HIGHLIGHTS
• Market Revenue Estimation and Forecast (2018 – 2026)
• Market Production Units Estimation and Forecast (2018 – 2026)
• Market Sales/Consumption Volume Estimation and Forecast (2018 – 2026)
• Breakdown of Revenue by Segments (2018 – 2026)
• Breakdown of Production Volume by Segments (2018 – 2026)
• Breakdown of Sales Volume by Segments (2018 – 2026)
• Gross Margin and Profitability Analysis of Companies
• Business Trend, Price Trend, and Expansion Analysis
• Import and Export Analysis
• Regional Analysis and Market Data Breakdown
MARKET SEGMENTATION
By Resolution Outlook ($Revenue and Unit Sales, 2018-2026)
• 4K UHD TV
• 8K TV
• Full HD TV
• HD TV
By Screen Size Outlook ($Revenue and Unit Sales, 2018-2026)
• Below 32 inches
• 32 to 45 inches
• 46 to 55 inches
• 56 to 65 inches
• Above 65 inches
By Screen Type Outlook ($Revenue and Unit Sales, 2018-2026)
• Flat
• Curved
By Regional Outlook ($Revenue and Unit Sales, 2018-2026)
• North America
• Canada
• U.S
• Mexico
• Europe
• Germany
• U.K
• France
• Netherlands
• Austria
• Rest of Europe
• Asia-Pacific
• China
• India
• Japan
• South Korea
• Australia
• Rest of Asia Pacific
• The Middle East and Africa
• Saudi Arabia
• United Arab Emirates
• Rest of Middle East
• Africa
• South America
• Brazil
• Argentina
• Rest of South America
MARKET PLAYERS
• LG Electronics
• Panasonic Corporation
• Samsung Electronics Corporation Limited
• Sony Corporation
• Videocon Industries Limited
• Hisense Group
• Haier Electronics Group Corporation Limited
• Micromax Informatics
• Sansui Electric Corporation
CHAPTER 1. INTRODUCTION
1.1. RESEARCH METHODOLOGY
1.1.1. Data Collection
1.1.2. Data Modeling
1.1.3. Historical Revenue and Sales Estimation
1.1.4. Data Triangulation
1.2. RESEARCH PROCESS
1.2.1. Primary Research
1.2.2. Secondary Research
1.2.3. Survey Data
1.2.4. Validation by In-House Expert
1.3. SMART TV MARKET OVERVIEW
1.3.1. Research Scope and Market Definition
1.3.2. Executive Summary
CHAPTER 2. GLOBAL SMART TV MARKET DEMAND SIDE ANALYSIS
2.1. SMART TV MARKET CONSUMPTION VOLUME (MILLION UNITS), 2018 – 2025
2.2. MARKET CONSUMPTION VOLUME SPLIT BY REGION (MILLION UNITS), 2018 – 2025
2.3. MARKET CONSUMPTION VOLUME SPLIT BY COUNTRIES (MILLION UNITS), 2018 – 2025
2.4. MARKET REVENUE (MILLION USD), 2018-2025
2.5. MARKET REVENUE SPLIT BY REGION (MILLION UNITS), 2018 – 2025
2.6. SMART TV MARKET REVENUE SPLIT BY COUNTRIES (MILLION UNITS), 2018 – 2025
CHAPTER 3. GLOBAL SMART TV MARKET SUPPLY SIDE ANALYSIS
3.1. SMART TV MARKET PRODUCTION VOLUME (MILLION UNITS), 2018 – 2025
3.2. MARKET PRODUCTION VOLUME SPLIT BY REGION (MILLION UNITS), 2018-2025
3.3. MARKET PRODUCTION VOLUME SPLIT/RANKING BY COUNTRIES (MILLION UNITS), 2018 – 2025
CHAPTER 4. GLOBAL SMART TV MARKET COMPETITIVE SCENARIO & BUSINESS OPPORTUNITY ANALYSIS
4.1. COMPETITIVE STRENGTH RANKING BY MAJOR COUNTRIES, 2018
4.2. MARKET ATTRACTIVENESS RANKING BY MAJOR COUNTRIES, 2018 - 2025
4.3. EMERGING BUSINESS OPPORTUNITIES AND GROWTH PROSPECTS
4.3.1. Growth Drivers
4.3.2. Market Restraints
4.3.2. Opportunities
CHAPTER 5. GLOBAL SMART TV MARKET ENTRY STRATEGIES
5.1. ENTRY STRATEGIES IN DEVELOPING MARKETS
5.2. ENTRY STRATEGIES IN DEVELOPED MARKETS
CHAPTER 6. GLOBAL SMART TV MARKET BY RESOLUTION
6.1. SEGMENT OUTLINE
6.2. REVENUE SHARE BY RESOLUTION, $MILLION, 2018 – 2025
6.2. CONSUMPTION SHARE BY RESOLUTION, MILLION UNITS, 2018 - 2025
6.3. PRODUCTION SHARE BY RESOLUTION, MILLION UNITS, 2018 – 2025
6.4. 4K UHD TV
6.4.1. Market determinants and trend analysis
6.4.2. Market revenue, sales and production volume, 2018 – 2025
6.5. 8K TV
6.5.1. Market determinants and trend analysis
6.5.2. Market revenue, sales and production volume, 2018 – 2025
6.6. FULL HD TV
6.6.1. Market determinants and trend analysis
6.6.2. Market revenue, sales and production volume, 2018 – 2025
6.7. HD TV
6.7.1. Market determinants and trend analysis
6.7.2. Market revenue, sales and production volume, 2018 – 2025
CHAPTER 7. GLOBAL SMART TV MARKET BY SCREEN SIZE
7.1. SEGMENT OUTLINE
7.2. REVENUE SHARE BY SCREEN SIZE, $MILLION, 2018 – 2025
7.2. CONSUMPTION SHARE BY SCREEN SIZE, MILLION UNITS, 2018 - 2025
7.3. PRODUCTION SHARE BY SCREEN SIZE, MILLION UNITS, 2018 – 2025
7.4. BELOW 32 INCHES
7.4.1. Market determinants and trend analysis
7.4.2. Market revenue, sales and production volume, 2018 – 2025
7.5. 32 TO 45 INCHES
7.5.1. Market determinants and trend analysis
7.5.2. Market revenue, sales and production volume, 2018 – 2025
7.6. 46 TO 55 INCHES
7.6.1. Market determinants and trend analysis
7.6.2. Market revenue, sales and production volume, 2018 – 2025
7.7. 56 TO 65 INCHES
7.7.1. Market determinants and trend analysis
7.7.2. Market revenue, sales and production volume, 2018 – 2025
7.8. ABOVE 65 INCHES
7.8.1. Market determinants and trend analysis
7.8.2. Market revenue, sales and production volume, 2018 – 2025
CHAPTER 8. GLOBAL SMART TV MARKET BY SCREEN TYPE
8.1. SEGMENT OUTLINE
8.2. REVENUE SHARE BY SCREEN TYPE, $MILLION, 2018 – 2025
8.2. CONSUMPTION SHARE BY SCREEN TYPE, MILLION UNITS, 2018 - 2025
8.3. PRODUCTION SHARE BY SCREEN TYPE, MILLION UNITS, 2018 – 2025
8.4. FLAT
8.4.1. Market determinants and trend analysis
8.4.2. Market revenue, sales and production volume, 2018 – 2025
8.5. CURVED
8.5.1. Market determinants and trend analysis
8.5.2. Market revenue, sales and production volume, 2018 – 2025
CHAPTER 9. GLOBAL SMART TV MARKET BY REGIONS
9.1. REGIONAL OUTLOOK
9.2. MARKET PRODUCTION, CONSUMPTION & REVENUE BY REGION, 2018-2025
9.3. NORTH AMERICA
9.3.1. Current Trends and Future Prospects
9.3.2. North America market revenue, sales and production volume, 2018 – 2025
9.3.3. The U.S.
9.3.3.1. Smart TV Market Revenue $Million (2018 – 2025)
9.3.3.2. Smart TV Market Consumption Million Units (2018 – 2025)
9.3.3.3. Smart TV Market Production Million Units (2018 – 2025)
9.3.4. Canada
9.3.4.1. Smart TV Market Revenue $Million (2018 – 2025)
9.3.4.2. Smart TV Market Consumption Million Units (2018 – 2025)
9.3.4.3. Smart TV Market Production Million Units (2018 – 2025)
9.3.5. Mexico
9.3.5.1. Smart TV Market Revenue $Million (2018 – 2025)
9.3.5.2. Smart TV Market Consumption Million Units (2018 – 2025)
9.3.5.3. Smart TV Market Production Million Units (2018 – 2025)
9.4. EUROPE
9.4.1. Current Trends and Future Prospects
9.4.2. Europe market revenue, sales and production volume, 2018 – 2025
9.4.3. U.K
9.4.3.1. Smart TV Market Revenue $Million (2018 – 2025)
9.4.3.2. Smart TV Market Consumption Million Units (2018 – 2025)
9.4.3.3. Smart TV Market Production Million Units (2018 – 2025)
9.4.4. Germany
9.4.4.1. Smart TV Market Revenue $Million (2018 – 2025)
9.4.4.2. Smart TV Market Consumption Million Units (2018 – 2025)
9.4.4.3. Smart TV Market Production Million Units (2018 – 2025)
9.4.5. France
9.4.5.1. Smart TV Market Revenue $Million (2018 – 2025)
9.4.5.2. Smart TV Market Consumption Million Units (2018 – 2025)
9.4.5.3. Smart TV Market Production Million Units (2018 – 2025)
9.4.6. Italy
9.4.6.1. Smart TV Market Revenue $Million (2018 – 2025)
9.4.6.2. Smart TV Market Consumption Million Units (2018 – 2025)
9.4.6.3. Smart TV Market Production Million Units (2018 – 2025)
9.4.7. Rest of Europe
9.4.7.1. Smart TV Market Revenue $Million (2018 – 2025)
9.4.7.2. Smart TV Market Consumption Million Units (2018 – 2025)
9.4.7.3. Smart TV Market Production Million Units (2018 – 2025)
9.5. ASIA PACIFIC
9.5.1. Current Trends and Future Prospects
9.5.2. Europe market revenue, sales and production volume, 2018 – 2025
9.5.3. India
9.5.3.1. Smart TV Market Revenue $Million (2018 – 2025)
9.5.3.2. Smart TV Market Consumption Million Units (2018 – 2025)
9.5.3.3. Smart TV Market Production Million Units (2018 – 2025)
9.5.4. Japan
9.5.4.1. Smart TV Market Revenue $Million (2018 – 2025)
9.5.4.2. Smart TV Market Consumption Million Units (2018 – 2025)
9.5.4.3. Smart TV Market Production Million Units (2018 – 2025)
9.5.5. China
9.5.5.1. Smart TV Market Revenue $Million (2018 – 2025)
9.5.5.2. Smart TV Market Consumption Million Units (2018 – 2025)
9.5.5.3. Smart TV Market Production Million Units (2018 – 2025)
9.5.6. South Korea
9.5.6.1. Smart TV Market Revenue $Million (2018 – 2025)
9.5.6.2. Smart TV Market Consumption Million Units (2018 – 2025)
9.5.6.3. Smart TV Market Production Million Units (2018 – 2025)
9.5.7. Rest of APAC
9.5.7.1. Smart TV Market Revenue $Million (2018 – 2025)
9.5.7.2. Smart TV Market Consumption Million Units (2018 – 2025)
9.5.7.3. Smart TV Market Production Million Units (2018 – 2025)
9.6. REST OF THE WORLD
9.6.1. Current Trends and Future Prospects
9.6.2. Europe market revenue, sales and production volume, 2018 – 2025
9.6.3. Latin America
9.6.3.1. Smart TV Market Revenue $Million (2018 – 2025)
9.6.3.2. Smart TV Market Consumption Million Units (2018 – 2025)
9.6.3.3. Smart TV Market Production Million Units (2018 – 2025)
9.6.4. Middle East
9.6.4.1. Smart TV Market Revenue $Million (2018 – 2025)
9.6.4.2. Smart TV Market Consumption Million Units (2018 – 2025)
9.6.4.3. Smart TV Market Production Million Units (2018 – 2025)
9.6.5. Africa
9.6.5.1. Smart TV Market Revenue $Million (2018 – 2025)
9.6.5.2. Smart TV Market Consumption Million Units (2018 – 2025)
9.6.5.3. Smart TV Market Production Million Units (2018 – 2025)
CHAPTER 10. KEY VENDOR PROFILES
10.1. LG Electronics
10.1.1. Company overview
10.1.2. Portfolio Analysis
10.1.3. Estimated revenue from smart TV business and market share
10.1.4. Regional & business segment Revenue Analysis
10.2. Panasonic Corporation
10.2.1. Company overview
10.2.2. Portfolio Analysis
10.2.3. Estimated revenue from smart TV business and market share
10.2.4. Regional & business segment Revenue Analysis
10.3. Samsung Electronics Corporation Limited
10.3.1. Company overview
10.3.2. Portfolio Analysis
10.3.3. Estimated revenue from smart TV business and market share
10.3.4. Regional & business segment Revenue Analysis
10.4. Sony Corporation
10.4.1. Company overview
10.4.2. Portfolio Analysis
10.4.3. Estimated revenue from smart TV business and market share
10.4.4. Regional & business segment Revenue Analysis
10.5. Videocon Industries Limited
10.5.1. Company overview
10.5.2. Portfolio Analysis
10.5.3. Estimated revenue from smart TV business and market share
10.5.4. Regional & business segment Revenue Analysis
10.6. Hisense Group
10.6.1. Company overview
10.6.2. Portfolio Analysis
10.6.3. Estimated revenue from smart TV business and market share
10.6.4. Regional & business segment Revenue Analysis
10.7. Haier Electronics Group Corporation Limited
10.7.1. Company overview
10.7.2. Portfolio Analysis
10.7.3. Estimated revenue from smart TV business and market share
10.7.4. Regional & business segment Revenue Analysis
10.8. Micromax Informatics
10.8.1. Company overview
10.8.2. Portfolio Analysis
10.8.3. Estimated revenue from smart TV business and market share
10.8.4. Regional & business segment Revenue Analysis
10.9. Sansui Electric Corporation
10.9.1. Company overview
10.9.2. Portfolio Analysis
10.9.3. Estimated revenue from smart TV business and market share
10.9.4. Regional & business segment Revenue Analysis
PURCHASE OPTIONS
20% Free Customization ON ALL PURCHASE
*Terms & Conditions Apply
Looking for report on this market in a particular region or country? Get In Touch
Request Free Sample
Please fill in the form below to Request for free Sample Report
-
Office Hours Mon - Sat 10:00 - 16:00
-
Call Us +91 6201075429
-
Send Us Mail sales@marketdecipher.com
Market Decipher is a market research and consultancy firm involved in provision of market reports to organisations of varied sizes; small, large and medium.

© 2018 Market Decipher. All Rights Reserved