3D Display Market Revenue and Sales Volume Forecasts Report, 2019-2026
By Product (Stereoscopic, Volumetric, HMD), By Technology (OLED, DLP, LED, PDP), By Application (Monitors, Smartphone, T.V, Mobile computing, HMD), By Region (North America, Europe, APAC, Rest of the World)
- Report ID : MD1003 |
- Pages : 199 |
- Tables : 95 |
- Formats :


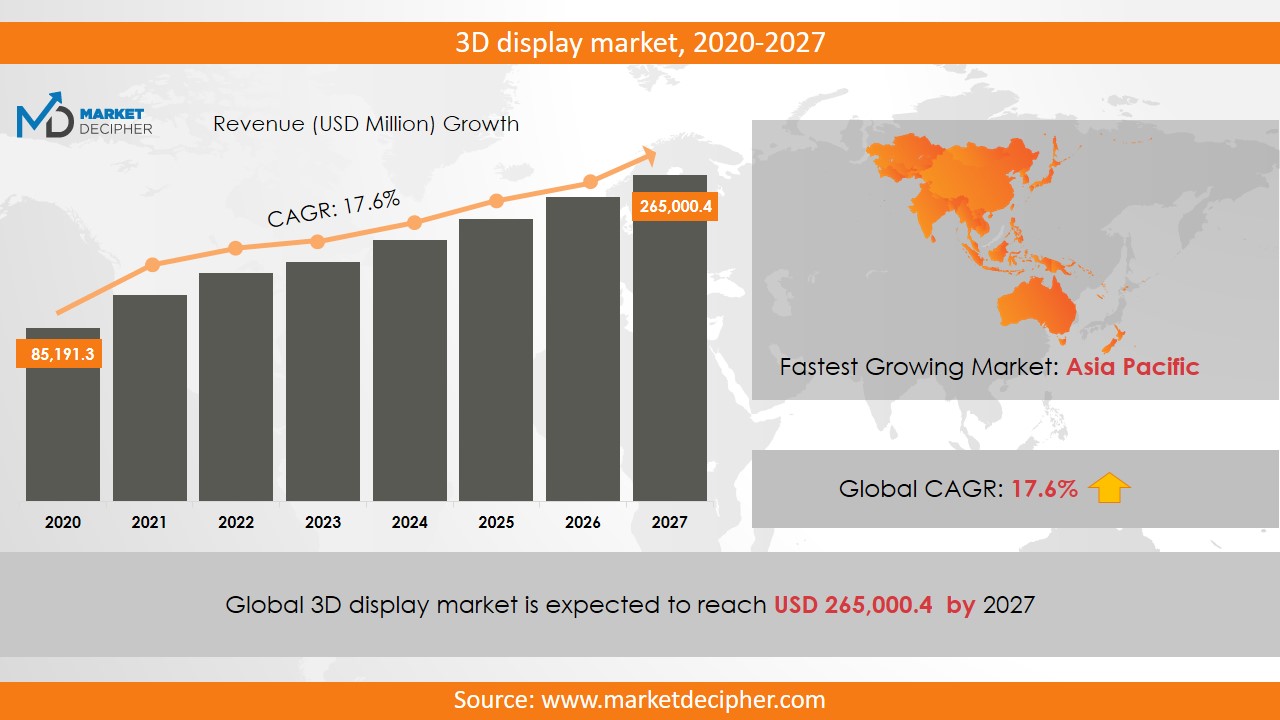
3D Display market size shall reach a value of $265.4 billion in 2027, growing with a CAGR of 17.6% during the forecast period of 2020 to 2027. In terms of volume sales, the market is anticipated to reach XX Units.
3D Displays convey the effect of volume and 3-dimensional visual experience to the viewer. The use of 3D display technologies is emerging in various fields such as gaming, photography, education, gaming, engineering simulation, and defense. However, the factors such as high cost, and health-related issues like nausea, headaches, and eye disorders are interrupting the 3D display market growth. The 3D display market will witness a significant augmentation due to the increasing application of 3D displays in electronic gadgets such as smartphones and TVs.
Owing to the latest trend of 3-dimensional viewing experiences and the growing attraction of consumers towards 3D movies, 3D display market sales are expected to increase significantly during the forecast. Although, the lack of 3D content is one of the major restraints in the industry growth as there are limited options available for experiencing 3D visuals. However, increasing awareness about consumer preference in this field and the development of high definition technology is contributing significantly to the expansion of the market. The growing rate of application of these displays in various devices like Monitors, Smartphones, TVs, Notebooks, PCs, and Digital Photo Frames is expected to drive the 3D display market shares.
REGIONAL ANALYSIS
Due to the introduction of advanced technologies and the increasing use of Internet services in North America, the region is expected to hold the largest share of the overall revenue. Increasing the use of 3D display technology in entertainment, gaming, defense, and engineering simulations will also increase revenue in the forecast period. The Asia Pacific is expected to grow at the fastest rate owing to the widening base of the middle-class population due to improving living standards in developing countries including India and China. Technological advancement, increasing access to smartphones and adoption of digital services are key factors affecting the market growth. Apart from this, the increasing demand for video games with exceptional displays using 3D visuals proves to be a great support for the market share size.
SEGMENT ANALYSIS
Stereoscopic 3D displays are used prominently in the gaming and entertainment areas. 3D Displays based on LED technology are used commonly because the LED panels provide quick response and good picture quality. Nowadays, consumers prefer to watch movies at home, on the computer, or TV. Thus, TVs are the biggest applications of 3D displays. The volumetric 3D display market crossed $11.3 Billion in 2018. In 2018; LED technology was the leading technology in contributing to overall revenue. LED panels are widely used as backlighting solutions to increase image quality and to get faster feedback.
During the forecast period, the OLED technology segment will evolve with the highest CAGR. Improved picture quality and performance as compared to traditional displays are the factors responsible for the development of this segment. Manufacturers have focused on developing new and innovative products such as smart TVs and ultra-HD 4K TVs which frequently use this technology. Further, the development of new products is expected to accelerate market growth tremendously during the forecast period.
INDUSTRY PLAYER ANALYSIS
Major industry players have been analyzed with coverage on their operating areas, revenues, and other strategic aspects. These industry players include Sony Corporation, Panasonic Corporation, Samsun Electronics Corporation, Toshiba Corporation, Sharp Corporation, 3D fusion, 3DIcon, Fujifilm Corporation, and Mitsubishi Electric Corporation. Apple launched SmartWatch with a flexible OLED display that presents high-resolution graphics and text images. Now, the focus of several industry players is on the displays based on LED having numerous applications in monitors, smartphones, TVs, and HMDs. Many startups are entering this industry with a view to capturing the growth potential. A strategic business plan can help them with better decision making. Other industries in this domain that is growing at a high CAGR include 3D Projection Systems Market and Smart Phone 3D Camera Market.
COVERAGE HIGHLIGHTS
• Market Revenue Estimation and 3D Display Market Forecast (2018 – 2026)
• Market Production Units Estimation and Forecast (2018 – 2026)
• Market Sales/Consumption Volume Estimation and Forecast (2018 – 2026)
• Breakdown of Revenue by Segments (2018 – 2026)
• Breakdown of Production Volume by Segments (2018 – 2026)
• Breakdown of Sales Volume by Segments (2018 – 2026)
• Gross Margin and Profitability Analysis of Companies
• Business Trend, Price Trend, and Expansion Analysis
• Import and Export Analysis
• Regional Analysis and Market Data Breakdown
MARKET SEGMENTATION
By Product Outlook ($Revenue and Unit Sales, 2018-2026)
• Stereoscopic
• Volumetric
• Head Mounted Display (HMD)
By Technology Outlook ($Revenue and Unit Sales, 2018-2026)
• OLED
• DLP
• LED
• PDP
By Application Outlook ($Revenue and Unit Sales, 2018-2026)
• Monitors
• Smartphones
• T.V
• Mobile Computing Devices
• Head Mounted Display
• Projectors
• Others
By Regional Outlook ($Revenue and Unit Sales, 2018-2026)
• North America
• Canada
• U.S
• Mexico
• Europe
• Germany
• U.K
• France
• Netherlands
• Austria
• Rest of Europe
• Asia-Pacific
• China
• India
• Japan
• South Korea
• Australia
• Rest of Asia Pacific
• The Middle East and Africa
• Saudi Arabia
• United Arab Emirates
• Rest of Middle East
• Africa
• South America
• Brazil
• Argentina
• Rest of South America
MARKET PLAYER ANALYSIS
• Sony Corporation
• Panasonic Corporation
• Samsun Electronics Corporation
• Toshiba Corporation
• Sharp Corporation
• 3D fusion
• 3DIcon
• Fujifilm Corporation
• Mitsubishi Electric Corporation
Need report on this market for specific region or Country? Or need a customized report as per your need? Want to know discounts as available?
Email US
David Correa
Or Fill the form below "Sample Request Form" with your queries in message box.
CHAPTER 1. INTRODUCTION
1.1. RESEARCH METHODOLOGY
1.1.1. Data Collection
1.1.2. Data Modeling
1.1.3. Historical Revenue and Sales Estimation
1.1.4. Data Triangulation
1.2. RESEARCH PROCESS
1.2.1. Primary Research
1.2.2. Secondary Research
1.2.3. Survey Data
1.2.4. Validation by In-House Expert
1.3. 3D DISPLAY MARKET OVERVIEW
1.3.1. Research Scope and Market Definition
1.3.2. Executive Summary
CHAPTER 2. GLOBAL 3D DISPLAY MARKET DEMAND SIDE ANALYSIS
2.1. 3D DISPLAY MARKET CONSUMPTION VOLUME (MILLION UNITS), 2018 – 2025
2.2. MARKET CONSUMPTION VOLUME SPLIT BY REGION (MILLION UNITS), 2018 – 2025
2.3. MARKET CONSUMPTION VOLUME SPLIT BY COUNTRIES (MILLION UNITS), 2018 – 2025
2.4. MARKET REVENUE (MILLION USD), 2018-2025
2.5. MARKET REVENUE SPLIT BY REGION (MILLION UNITS), 2018 – 2025
2.6. 3D DISPLAY MARKET REVENUE SPLIT BY COUNTRIES (MILLION UNITS), 2018 – 2025
CHAPTER 3. GLOBAL 3D DISPLAY MARKET SUPPLY SIDE ANALYSIS
3.1. 3D DISPLAY MARKET PRODUCTION VOLUME (MILLION UNITS), 2018 – 2025
3.2. MARKET PRODUCTION VOLUME SPLIT BY REGION (MILLION UNITS), 2018-2025
3.3. MARKET PRODUCTION VOLUME SPLIT/RANKING BY COUNTRIES (MILLION UNITS), 2018 – 2025
CHAPTER 4. GLOBAL 3D DISPLAY MARKET COMPETITIVE SCENARIO & BUSINESS OPPORTUNITY ANALYSIS
4.1. COMPETITIVE STRENGTH RANKING BY MAJOR COUNTRIES, 2018
4.2. MARKET ATTRACTIVENESS RANKING BY MAJOR COUNTRIES, 2018 - 2025
4.3. EMERGING BUSINESS OPPORTUNITIES AND GROWTH PROSPECTS
4.3.1. Growth Drivers
4.3.2. Market Restraints
4.3.2. Opportunities
CHAPTER 5. GLOBAL 3D DISPLAY MARKET ENTRY STRATEGIES
5.1. ENTRY STRATEGIES IN DEVELOPING MARKETS
5.2. ENTRY STRATEGIES IN DEVELOPED MARKETS
CHAPTER 6. GLOBAL 3D DISPLAY MARKET BY PRODUCT
6.1. SEGMENT OUTLINE
6.2. REVENUE SHARE BY PRODUCT, $MILLION, 2018 – 2025
6.2. CONSUMPTION SHARE BY PRODUCT, MILLION UNITS, 2018 - 2025
6.3. PRODUCTION SHARE BY PRODUCT, MILLION UNITS, 2018 – 2025
6.4. STEREOSCOPIC
6.4.1. Market determinants and trend analysis
6.4.2. Market revenue, sales and production volume, 2018 – 2025
6.5. VOLUMETRIC
6.5.1. Market determinants and trend analysis
6.5.2. Market revenue, sales and production volume, 2018 – 2025
6.6. HEAD MOUNTED DISPLAY (HMD)
6.6.1. Market determinants and trend analysis
6.6.2. Market revenue, sales and production volume, 2018 – 2025
CHAPTER 7. GLOBAL 3D DISPLAY MARKET BY TECHNOLOGY
7.1. SEGMENT OUTLINE
7.2. REVENUE SHARE BY TECHNOLOGY, $MILLION, 2018 – 2025
7.2. CONSUMPTION SHARE BY TECHNOLOGY, MILLION UNITS, 2018 - 2025
7.3. PRODUCTION SHARE BY TECHNOLOGY, MILLION UNITS, 2018 – 2025
7.4. OLED
7.4.1. Market determinants and trend analysis
7.4.2. Market revenue, sales and production volume, 2018 – 2025
7.5. DLP
7.5.1. Market determinants and trend analysis
7.5.2. Market revenue, sales and production volume, 2018 – 2025
7.6. LED
7.6.1. Market determinants and trend analysis
7.6.2. Market revenue, sales and production volume, 2018 – 2025
7.7. PDP
7.7.1. Market determinants and trend analysis
7.7.2. Market revenue, sales and production volume, 2018 – 2025
CHAPTER 8. GLOBAL 3D DISPLAY MARKET BY APPLICATION
8.1. SEGMENT OUTLINE
8.2. REVENUE SHARE BY APPLICATION, $MILLION, 2018 – 2025
8.2. CONSUMPTION SHARE BY APPLICATION, MILLION UNITS, 2018 - 2025
8.3. PRODUCTION SHARE BY APPLICATION, MILLION UNITS, 2018 – 2025
8.4. MONITORS
8.4.1. Market determinants and trend analysis
8.4.2. Market revenue, sales and production volume, 2018 – 2025
8.5. SMARTPHONES
8.5.1. Market determinants and trend analysis
8.5.2. Market revenue, sales and production volume, 2018 – 2025
8.6. T.V
8.6.1. Market determinants and trend analysis
8.6.2. Market revenue, sales and production volume, 2018 – 2025
8.7. MOBILE COMPUTING DEVICES
8.7.1. Market determinants and trend analysis
8.7.2. Market revenue, sales and production volume, 2018 – 2025
8.8. HEAD MOUNTED DISPLAY
8.8.1. Market determinants and trend analysis
8.8.2. Market revenue, sales and production volume, 2018 – 2025
8.9. PROJECTORS
8.9.1. Market determinants and trend analysis
8.9.2. Market revenue, sales and production volume, 2018 – 2025
8.10. OTHERS
8.10.1. Market determinants and trend analysis
8.10.2. Market revenue, sales and production volume, 2018 – 2025
CHAPTER 9. GLOBAL 3D DISPLAY MARKET BY REGIONS
9.1. REGIONAL OUTLOOK
9.2. MARKET PRODUCTION, CONSUMPTION & REVENUE BY REGION, 2018-2025
9.3. NORTH AMERICA
9.3.1. Current Trends and Future Prospects
9.3.2. North America market revenue, sales and production volume, 2018 – 2025
9.3.3.U.S.
9.3.3.1. 3D Display Market Revenue $Million (2018 – 2025)
9.3.3.2. 3D Display Market Consumption Million Units (2018 – 2025)
9.3.3.3. 3D Display Market Production Million Units (2018 – 2025)
9.3.4. Canada
9.3.4.1. 3D Display Market Revenue $Million (2018 – 2025)
9.3.4.2. 3D Display Market Consumption Million Units (2018 – 2025)
9.3.4.3. 3D Display Market Production Million Units (2018 – 2025)
9.3.5. Mexico
9.3.5.1. 3D Display Market Revenue $Million (2018 – 2025)
9.3.5.2. 3D Display Market Consumption Million Units (2018 – 2025)
9.3.5.3. 3D Display Market Production Million Units (2018 – 2025)
9.4. EUROPE
9.4.1. Current Trends and Future Prospects
9.4.2. Europe market revenue, sales and production volume, 2018 – 2025
9.4.3. U.K
9.4.3.1. 3D Display Market Revenue $Million (2018 – 2025)
9.4.3.2. 3D Display Market Consumption Million Units (2018 – 2025)
9.4.3.3. 3D Display Market Production Million Units (2018 – 2025)
9.4.4. Germany
9.4.4.1. 3D Display Market Revenue $Million (2018 – 2025)
9.4.4.2. 3D Display Market Consumption Million Units (2018 – 2025)
9.4.4.3. 3D Display Market Production Million Units (2018 – 2025)
9.4.5. France
9.4.5.1. 3D Display Market Revenue $Million (2018 – 2025)
9.4.5.2. 3D Display Market Consumption Million Units (2018 – 2025)
9.4.5.3. 3D Display Market Production Million Units (2018 – 2025)
9.4.6. Italy
9.4.6.1. 3D Display Market Revenue $Million (2018 – 2025)
9.4.6.2. 3D Display Market Consumption Million Units (2018 – 2025)
9.4.6.3. 3D Display Market Production Million Units (2018 – 2025)
9.4.7. Rest of Europe
9.4.7.1. 3D Display Market Revenue $Million (2018 – 2025)
9.4.7.2. 3D Display Market Consumption Million Units (2018 – 2025)
9.4.7.3. 3D Display Market Production Million Units (2018 – 2025)
9.5. ASIA PACIFIC
9.5.1. Current Trends and Future Prospects
9.5.2. Europe market revenue, sales and production volume, 2018 – 2025
9.5.3. India
9.5.3.1. 3D Display Market Revenue $Million (2018 – 2025)
9.5.3.2. 3D Display Market Consumption Million Units (2018 – 2025)
9.5.3.3. 3D Display Market Production Million Units (2018 – 2025)
9.5.4. Japan
9.5.4.1. 3D Display Market Revenue $Million (2018 – 2025)
9.5.4.2. 3D Display Market Consumption Million Units (2018 – 2025)
9.5.4.3. 3D Display Market Production Million Units (2018 – 2025)
9.5.5. China
9.5.5.1. 3D Display Market Revenue $Million (2018 – 2025)
9.5.5.2. 3D Display Market Consumption Million Units (2018 – 2025)
9.5.5.3. 3D Display Market Production Million Units (2018 – 2025)
9.5.6. South Korea
9.5.6.1. 3D Display Market Revenue $Million (2018 – 2025)
9.5.6.2. 3D Display Market Consumption Million Units (2018 – 2025)
9.5.6.3. 3D Display Market Production Million Units (2018 – 2025)
9.5.7. Rest of APAC
9.5.7.1. 3D Display Market Revenue $Million (2018 – 2025)
9.5.7.2. 3D Display Market Consumption Million Units (2018 – 2025)
9.5.7.3. 3D Display Market Production Million Units (2018 – 2025)
9.6. REST OF THE WORLD
9.6.1. Current Trends and Future Prospects
9.6.2. Europe market revenue, sales and production volume, 2018 – 2025
9.6.3. Latin America
9.6.3.1. 3D Display Market Revenue $Million (2018 – 2025)
9.6.3.2. 3D Display Market Consumption Million Units (2018 – 2025)
9.6.3.3. 3D Display Market Production Million Units (2018 – 2025)
9.6.4. Middle East
9.6.4.1. 3D Display Market Revenue $Million (2018 – 2025)
9.6.4.2. 3D Display Market Consumption Million Units (2018 – 2025)
9.6.4.3. 3D Display Market Production Million Units (2018 – 2025)
9.6.5. Africa
9.6.5.1. 3D Display Market Revenue $Million (2018 – 2025)
9.6.5.2. 3D Display Market Consumption Million Units (2018 – 2025)
9.6.5.3. 3D Display Market Production Million Units (2018 – 2025)
CHAPTER 10. KEY VENDOR PROFILES
10.1. Sony Corporation
10.1.1. Company overview
10.1.2. Portfolio Analysis
10.1.3. Estimated revenue from 3D display business and market share
10.1.4. Regional & business segment Revenue Analysis
10.2. Panasonic Corporation
10.2.1. Company overview
10.2.2. Portfolio Analysis
10.2.3. Estimated revenue from 3D display business and market share
10.2.4. Regional & business segment Revenue Analysis
10.3. Samsun Electronics Corporation
10.3.1. Company overview
10.3.2. Portfolio Analysis
10.3.3. Estimated revenue from 3D display business and market share
10.3.4. Regional & business segment Revenue Analysis
10.4. Toshiba Corporation
10.4.1. Company overview
10.4.2. Portfolio Analysis
10.4.3. Estimated revenue from 3D display business and market share
10.4.4. Regional & business segment Revenue Analysis
10.5. Sharp Corporation
10.5.1. Company overview
10.5.2. Portfolio Analysis
10.5.3. Estimated revenue from 3D display business and market share
10.5.4. Regional & business segment Revenue Analysis
10.6. 3D fusion
10.6.1. Company overview
10.6.2. Portfolio Analysis
10.6.3. Estimated revenue from 3D display business and market share
10.6.4. Regional & business segment Revenue Analysis
10.7. 3DIcon
10.7.1. Company overview
10.7.2. Portfolio Analysis
10.7.3. Estimated revenue from 3D display business and market share
10.7.4. Regional & business segment Revenue Analysis
10.8. Fujifilm Corporation
10.8.1. Company overview
10.8.2. Portfolio Analysis
10.8.3. Estimated revenue from 3D display business and market share
10.8.4. Regional & business segment Revenue Analysis
10.9. Mitsubishi Electric Corporation
10.9.1. Company overview
10.9.2. Portfolio Analysis
10.9.3. Estimated revenue from 3D display business and market share
10.9.4. Regional & business segment Revenue Analysis
10.10. Apple Inc.
10.10.1. Company overview
10.10.2. Portfolio Analysis
10.10.3. Estimated revenue from 3D display business and market share
10.10.4. Regional & business segment Revenue Analysis
PURCHASE OPTIONS
20% Free Customization ON ALL PURCHASE
*Terms & Conditions Apply
Looking for report on this market in a particular region or country? Get In Touch
Request Free Sample
Please fill in the form below to Request for free Sample Report
-
Office Hours Mon - Sat 10:00 - 16:00
-
Call Us +91 6201075429
-
Send Us Mail sales@marketdecipher.com
Market Decipher is a market research and consultancy firm involved in provision of market reports to organisations of varied sizes; small, large and medium.

© 2018 Market Decipher. All Rights Reserved