E Paper Display Market Revenue, Sales Volume & Trend Forecast Report, 2019-2026
By Product (Smart cards, Mobile Devices, E-Readers, Smart packaging, Signage and Posters, Auxiliary Displays and Others), By Technology (Electrowetting display, Electrophoretic display, Garcon, Interferometric modulator display, Cholesteric display, Electro fluidic display, and Others), By End-Use (Entertainment, Architecture, Medical, Consumer Electronics, Automotive, Packaging, Retail and Others), By Region (North America,Europe,APAC and Rest of the World)
- Report ID : MD1023 |
- Pages : 198 |
- Tables : 96 |
- Formats :


E-Paper Display market revenue shall reach a value of $48.3 Billion in 2026, growing with a CAGR of 27.1% during the forecast period of 2018 to 2026. In terms of volume sales, the market is anticipated to reach XX Units.
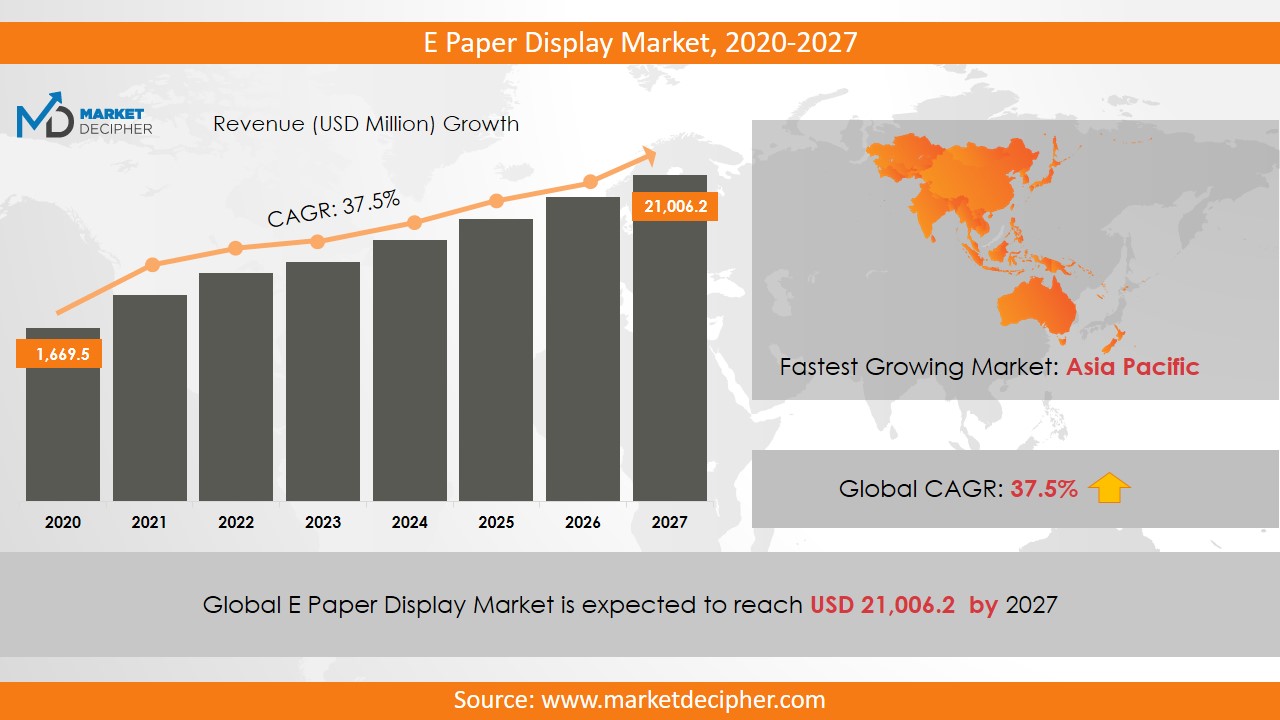
The e-paper display is an electrically charged display that mimics the look of ink on paper. Factors like better performance and low power consumption are increasing the e-paper display markets growth. These displays are also known as bit stable displays. The growing awareness about environment conservation and the advanced features of this display, such as flexibility, high resolution, and vibrant color are promoting the e-paper display market growth. This display has its various applications in eBooks, digital displays and many more. With key trends such as the use of tablets and smartphones and increasing use of the internet, there will be a notable increase in the overall revenue. However, its low speed and low availability of raw materials inhibit the growth of the market. In addition to this, the high cost of this technology is also a big challenge for its growth shortly.
Since the trees work as raw material for the production of paper, the estimates show that about 29% of the woodcut is used for paper production. Due to this, there has been a significant increase in global warming and other environmental concerns. Therefore, the use of e-paper displays eliminates concerns to some extent. For the protection of the environment, strict government rules have been made to adopt these displays to reduce the cutting of trees. Further, these days consumer preferences are shifting towards e-book reading as during online reading, applications like Kobo Touch and Amazon Kindle use these displays to provide a realistic experience to the reader. All these factors come up together to increase the e-paper display market shares.
REGIONAL ANALYSIS
The North America region is the dominant region in the revenue of the market in 2018 and it is expected that this region going to continue this trend over the forecast period. The Asia Pacific region also contributed significantly to the market growth owing to the increasing interest of the market players to invest in this market.
SEGMENTAL ANALYSIS
In terms of Product, the e-paper display market research report provides a detailed analysis of the smart cards, mobile devices, e-readers, smart packaging, signage and Posters, auxiliary displays and others. By technology, the segmentation has been done as an electrowetting display, electrophoretic display, Garcon, interferometric modulator display, cholesteric display, electro-fluidic display, and others. Based on end- use the market has been segmented as media and entertainment, architecture, medical, consumer electronics, automotive, packaging retail, and others.
INDUSTRY PLAYER ANALYSIS
Major industry players have been analyzed with coverage on their operating areas, revenues, and other strategic aspects. These industry players include Qualcomm MEMS Technologies Limited, E Ink Holdings Incorporated, Hanvon Technology, NEC LCD Technologies Limited, LG Display, Sony Corporation, Delta Electronics Incorporated, Cambrios Technologies Corporation, Gamma Dynamics, Pervasive Displays and Amazon Liquavista B.V. Various industry players adopting advanced strategies to increase the e-paper display business size across the world. It is estimated that in November 2017, the only company which offered full-color e-paper video was CLEARink displays. Other industries in this domain that is growing at a high CAGR include Thermal Paper Market and Paper and paper board packing Market.
COVERAGE HIGHLIGHTS
Revenue Estimation and Forecast (2018 – 2026)
Production Estimation and Forecast (2018 – 2026)
Sales/Consumption Volume Estimation and Forecast (2018 – 2026)
Breakdown of Revenue by Segments (2018 – 2026)
Breakdown of Production by Segments (2018 – 2026)
Breakdown of Sales Volume by Segments (2018 – 2026)
Gross Margin and Profitability Analysis of Companies
Business Trend and Expansion Analysis
Import and Export Analysis
Regional Analysis and Data Breakdown
SEGMENTAL ANALYSIS:
By Product ($Revenue and Unit Sales, 2018-2026)
Smart Cards
Mobile Devices
E-Readers
Smart packaging
Signage and Posters
Auxiliary Displays
Others
By Technology ($Revenue and Unit Sales, 2018-2026)
Electro wetting Display
Electrophoretic Display
Gyricon
Interferometric Modulator Display
Cholesteric Display
Electrofludic Display
Others
By End-Use ($Revenue and Unit Sales, 2018-2026)
Media and Entertainment
Architecture
Medical
Consumer Electronics
Automotive
Packaging retail
Others
By Geography ($Revenue and Unit Sales, 2018-2026)
North America
Mexico
U.S
Canada
Europe
France
U.K
Germany
Russia
Italy
Rest of Europe
Asia-Pacific
South Korea
India
Japan
China
Rest of Asia-Pacific
Rest of the World
Middle East
Latin America
Africa
CHAPTER 1. INTRODUCTION
1.1. RESEARCH METHODOLOGY
1.1.1. Data Collection
1.1.2. Data Modeling
1.1.3. Historical Revenue and Sales Estimation
1.1.4. Data Triangulation
1.2. RESEARCH PROCESS
1.2.1. Primary Research
1.2.2. Secondary Research
1.2.3. Survey Data
1.2.4. Validation by In-House Expert
1.3. E-PAPER DISPLAY MARKET OVERVIEW
1.3.1. Research Scope and Market Definition
1.3.2. Executive Summary
CHAPTER 2. GLOBAL E-PAPER DISPLAY MARKET DEMAND SIDE ANALYSIS
2.1. E-PAPER DISPLAY MARKET CONSUMPTION VOLUME (MILLION UNITS), 2018 – 2025
2.2. MARKET CONSUMPTION VOLUME SPLIT BY REGION (MILLION UNITS), 2018 – 2025
2.3. MARKET CONSUMPTION VOLUME SPLIT BY COUNTRIES (MILLION UNITS), 2018 – 2025
2.4. MARKET REVENUE (MILLION USD), 2018-2025
2.5. MARKET REVENUE SPLIT BY REGION (MILLION UNITS), 2018 – 2025
2.6. E-PAPER DISPLAY MARKET REVENUE SPLIT BY COUNTRIES (MILLION UNITS), 2018 – 2025
CHAPTER 3. GLOBAL E-PAPER DISPLAY MARKET SUPPLY SIDE ANALYSIS
3.1. E-PAPER DISPLAY MARKET PRODUCTION VOLUME (MILLION UNITS), 2018 – 2025
3.2. MARKET PRODUCTION VOLUME SPLIT BY REGION (MILLION UNITS), 2018-2025
3.3. MARKET PRODUCTION VOLUME SPLIT/RANKING BY COUNTRIES (MILLION UNITS), 2018 – 2025
CHAPTER 4. GLOBAL E-PAPER DISPLAY MARKET COMPETITIVE SCENARIO & BUSINESS OPPORTUNITY ANALYSIS
4.1. COMPETITIVE STRENGTH RANKING BY MAJOR COUNTRIES, 2018
4.2. MARKET ATTRACTIVENESS RANKING BY MAJOR COUNTRIES, 2018 - 2025
4.3. EMERGING BUSINESS OPPORTUNITIES AND GROWTH PROSPECTS
4.3.1. Growth Drivers
4.3.2. Market Restraints
4.3.2. Opportunities
CHAPTER 5. GLOBAL E-PAPER DISPLAY MARKET ENTRY STRATEGIES
5.1. ENTRY STRATEGIES IN DEVELOPING MARKETS
5.2. ENTRY STRATEGIES IN DEVELOPED MARKETS
CHAPTER 6. GLOBAL E-PAPER DISPLAY MARKET BY PRODUCT
6.1. SEGMENT OUTLINE
6.2. REVENUE SHARE BY PRODUCT, $MILLION, 2018 – 2025
6.2. CONSUMPTION SHARE BY PRODUCT, MILLION UNITS, 2018 - 2025
6.3. PRODUCTION SHARE BY PRODUCT, MILLION UNITS, 2018 – 2025
6.4. SMART CARDS
6.4.1. Market determinants and trend analysis
6.4.2. Market revenue, sales and production volume, 2018 – 2025
6.5. MOBILE DEVICES
6.5.1. Market determinants and trend analysis
6.5.2. Market revenue, sales and production volume, 2018 – 2025
6.6. E-READERS
6.6.1. Market determinants and trend analysis
6.6.2. Market revenue, sales and production volume, 2018 – 2025
6.7. SMART PACKAGING
6.7.1. Market determinants and trend analysis
6.7.2. Market revenue, sales and production volume, 2018 – 2025
6.8. SIGNAGE AND POSTERS
6.8.1. Market determinants and trend analysis
6.8.2. Market revenue, sales and production volume, 2018 – 2025
6.9. AUXILIARY DISPLAYS
6.9.1. Market determinants and trend analysis
6.9.2. Market revenue, sales and production volume, 2018 – 2025
6.10. OTHERS
6.9.1. Market determinants and trend analysis
6.9.2. Market revenue, sales and production volume, 2018 – 2025
CHAPTER 7. GLOBAL E-PAPER DISPLAY MARKET BY TECHNOLOGY
7.1. SEGMENT OUTLINE
7.2. REVENUE SHARE BY TECHNOLOGY, $MILLION, 2018 – 2025
7.2. CONSUMPTION SHARE BY TECHNOLOGY, MILLION UNITS, 2018 - 2025
7.3. PRODUCTION SHARE BY TECHNOLOGY, MILLION UNITS, 2018 – 2025
7.4.ELECTROWETTING DISPLAY
7.4.1. Market determinants and trend analysis
7.4.2. Market revenue, sales and production volume, 2018 – 2025
7.5. ELECTROPHORETIC DISPLAY
7.5.1. Market determinants and trend analysis
7.5.2. Market revenue, sales and production volume, 2018 – 2025
7.6. GYRICON
7.6.1. Market determinants and trend analysis
7.6.2. Market revenue, sales and production volume, 2018 – 2025
7.7. INTERFEROMETRIC MODULATOR DISPLAY
7.7.1. Market determinants and trend analysis
7.7.2. Market revenue, sales and production volume, 2018 – 2025
7.8. CHOLESTERIC DISPLAY
7.8.1. Market determinants and trend analysis
7.8.2. Market revenue, sales and production volume, 2018 – 2025
7.9. ELECTROFLUDIC DISPLAY
7.9.1. Market determinants and trend analysis
7.9.2. Market revenue, sales and production volume, 2018 – 2025
7.10. OTHERS
7.10.1. Market determinants and trend analysis
7.10.2. Market revenue, sales and production volume, 2018 – 2025
CHAPTER 8. GLOBAL E-PAPER DISPLAY MARKET BY END- USE
8.1. SEGMENT OUTLINE
8.2. REVENUE SHARE BY END- USE, $MILLION, 2018 – 2025
8.2. CONSUMPTION SHARE BY END- USE, MILLION UNITS, 2018 - 2025
8.3. PRODUCTION SHARE BY END- USE, MILLION UNITS, 2018 – 2025
8.4. MEDIA AND ENTERTAINMENT
8.4.1. Market determinants and trend analysis
8.4.2. Market revenue, sales and production volume, 2018 – 2025
8.5. ARCHITECTURE
8.5.1. Market determinants and trend analysis
8.5.2. Market revenue, sales and production volume, 2018 – 2025
8.6. MEDICAL
8.6.1. Market determinants and trend analysis
8.6.2. Market revenue, sales and production volume, 2018 – 2025
8.7. CONSUMER ELECTRONICS
8.7.1. Market determinants and trend analysis
8.7.2. Market revenue, sales and production volume, 2018 – 2025
8.8. AUTOMOTIVE
8.8.1. Market determinants and trend analysis
8.8.2. Market revenue, sales and production volume, 2018 – 2025
8.9. PACKAGING RETAIL
8.9.1. Market determinants and trend analysis
8.9.2. Market revenue, sales and production volume, 2018 – 2025
8.10. OTHERS
8.10.1. Market determinants and trend analysis
8.10.2. Market revenue, sales and production volume, 2018 – 2025
CHAPTER 9. GLOBAL E-PAPER DISPLAY MARKET BY REGIONS
9.1. REGIONAL OUTLOOK
9.2. MARKET PRODUCTION, CONSUMPTION & REVENUE BY REGION, 2018-2025
9.3. NORTH AMERICA
9.3.1. Current Trends and Future Prospects
9.3.2. North America market revenue, sales and production volume, 2018 – 2025
9.3.3.U.S.
9.3.3.1. E-Paper Display Market Revenue $Million (2018 – 2025)
9.3.3.2. E-Paper Display Market Consumption Million Units (2018 – 2025)
9.3.3.3. E-Paper Display Market Production Million Units (2018 – 2025)
9.3.4. Canada
9.3.4.1. E-Paper Display Market Revenue $Million (2018 – 2025)
9.3.4.2. E-Paper Display Market Consumption Million Units (2018 – 2025)
9.3.4.3. E-Paper Display Market Production Million Units (2018 – 2025)
9.3.5. Mexico
9.3.5.1. E-Paper Display Market Revenue $Million (2018 – 2025)
9.3.5.2. E-Paper Display Market Consumption Million Units (2018 – 2025)
9.3.5.3. E-Paper Display Market Production Million Units (2018 – 2025)
9.4. EUROPE
9.4.1. Current Trends and Future Prospects
9.4.2. Europe market revenue, sales and production volume, 2018 – 2025
9.4.3. U.K
9.4.3.1. E-Paper Display Market Revenue $Million (2018 – 2025)
9.4.3.2. E-Paper Display Market Consumption Million Units (2018 – 2025)
9.4.3.3. E-Paper Display Market Production Million Units (2018 – 2025)
9.4.4. Germany
9.4.4.1. E-Paper Display Market Revenue $Million (2018 – 2025)
9.4.4.2. E-Paper Display Market Consumption Million Units (2018 – 2025)
9.4.4.3. E-Paper Display Market Production Million Units (2018 – 2025)
9.4.5. France
9.4.5.1. E-Paper Display Market Revenue $Million (2018 – 2025)
9.4.5.2. E-Paper Display Market Consumption Million Units (2018 – 2025)
9.4.5.3. E-Paper Display Market Production Million Units (2018 – 2025)
9.4.6. Italy
9.4.6.1. E-Paper Display Market Revenue $Million (2018 – 2025)
9.4.6.2. E-Paper Display Market Consumption Million Units (2018 – 2025)
9.4.6.3. E-Paper Display Market Production Million Units (2018 – 2025)
9.4.7. Rest of Europe
9.4.7.1. E-Paper Display Market Revenue $Million (2018 – 2025)
9.4.7.2. E-Paper Display Market Consumption Million Units (2018 – 2025)
9.4.7.3. E-Paper Display Market Production Million Units (2018 – 2025)
9.5. ASIA PACIFIC
9.5.1. Current Trends and Future Prospects
9.5.2. Europe market revenue, sales and production volume, 2018 – 2025
9.5.3. India
9.5.3.1. E-Paper Display Market Revenue $Million (2018 – 2025)
9.5.3.2. E-Paper Display Market Consumption Million Units (2018 – 2025)
9.5.3.3. E-Paper Display Market Production Million Units (2018 – 2025)
9.5.4. Japan
9.5.4.1. E-Paper Display Market Revenue $Million (2018 – 2025)
9.5.4.2. E-Paper Display Market Consumption Million Units (2018 – 2025)
9.5.4.3. E-Paper Display Market Production Million Units (2018 – 2025)
9.5.5. China
9.5.5.1. E-Paper Display Market Revenue $Million (2018 – 2025)
9.5.5.2. E-Paper Display Market Consumption Million Units (2018 – 2025)
9.5.5.3. E-Paper Display Market Production Million Units (2018 – 2025)
9.5.6. South Korea
9.5.6.1. E-Paper Display Market Revenue $Million (2018 – 2025)
9.5.6.2. E-Paper Display Market Consumption Million Units (2018 – 2025)
9.5.6.3. E-Paper Display Market Production Million Units (2018 – 2025)
9.5.7. Rest of APAC
9.5.7.1. E-Paper Display Market Revenue $Million (2018 – 2025)
9.5.7.2. E-Paper Display Market Consumption Million Units (2018 – 2025)
9.5.7.3. E-Paper Display Market Production Million Units (2018 – 2025)
9.6. REST OF THE WORLD
9.6.1. Current Trends and Future Prospects
9.6.2. Europe market revenue, sales and production volume, 2018 – 2025
9.6.3. Latin America
9.6.3.1. E-Paper Display Market Revenue $Million (2018 – 2025)
9.6.3.2. E-Paper Display Market Consumption Million Units (2018 – 2025)
9.6.3.3. E-Paper Display Market Production Million Units (2018 – 2025)
9.6.4. Middle East
9.6.4.1. E-Paper Display Market Revenue $Million (2018 – 2025)
9.6.4.2. E-Paper Display Market Consumption Million Units (2018 – 2025)
9.6.4.3. E-Paper Display Market Production Million Units (2018 – 2025)
9.6.5. Africa
9.6.5.1. E-Paper Display Market Revenue $Million (2018 – 2025)
9.6.5.2. E-Paper Display Market Consumption Million Units (2018 – 2025)
9.6.5.3. E-Paper Display Market Production Million Units (2018 – 2025)
CHAPTER 10. KEY VENDOR PROFILES
10.1. Qualcomm MEMS Technologies Limited
10.1.1. Company overview
10.1.2. Portfolio Analysis
10.1.3. Estimated revenue from e-paper display business and market share
10.1.4. Regional & business segment Revenue Analysis
10.2. E Ink Holdings Incorporated
10.2.1. Company overview
10.2.2. Portfolio Analysis
10.2.3. Estimated revenue from e-paper display business and market share
10.2.4. Regional & business segment Revenue Analysis
10.3. Hanvon Technology
10.3.1. Company overview
10.3.2. Portfolio Analysis
10.3.3. Estimated revenue from e-paper display business and market share
10.3.4. Regional & business segment Revenue Analysis
10.4. NEC LCD Technologies Limited
10.4.1. Company overview
10.4.2. Portfolio Analysis
10.4.3. Estimated revenue from e-paper display business and market share
10.4.4. Regional & business segment Revenue Analysis
10.5. LG Display
10.5.1. Company overview
10.5.2. Portfolio Analysis
10.5.3. Estimated revenue from e-paper display business and market share
10.5.4. Regional & business segment Revenue Analysis
10.6.corporation
10.6.1. Company overview
10.6.2. Portfolio Analysis
10.6.3. Estimated revenue from e-paper display business and market share
10.6.4. Regional & business segment Revenue Analysis
10.7. Delta Electronics Incorporated
10.7.1. Company overview
10.7.2. Portfolio Analysis
10.7.3. Estimated revenue from e-paper display business and market share
10.7.4. Regional & business segment Revenue Analysis
10.8. Cambrios Technologies Corporation
10.8.1. Company overview
10.8.2. Portfolio Analysis
10.8.3. Estimated revenue from e-paper display business and market share
10.8.4. Regional & business segment Revenue Analysis
10.9. Gamma Dynamics
10.9.1. Company overview
10.9.2. Portfolio Analysis
10.9.3. Estimated revenue from e-paper display business and market share
10.9.4. Regional & business segment Revenue Analysis
10.10. Pervasive Displays
10.10.1. Company overview
10.10.2. Portfolio Analysis
10.10.3. Estimated revenue from e-paper display business and market share
10.10.4. Regional & business segment Revenue Analysis
10.11. Amazon Liquavista B.V.
10.11.1. Company overview
10.11.2. Portfolio Analysis
10.11.3. Estimated revenue from e-paper display business and market share
10.11.4. Regional & business segment Revenue Analysis
PURCHASE OPTIONS
20% Free Customization ON ALL PURCHASE
*Terms & Conditions Apply
Looking for report on this market in a particular region or country? Get In Touch
Request Free Sample
Please fill in the form below to Request for free Sample Report
-
Office Hours Mon - Sat 10:00 - 16:00
-
Call Us +91 6201075429
-
Send Us Mail sales@marketdecipher.com
Market Decipher is a market research and consultancy firm involved in provision of market reports to organisations of varied sizes; small, large and medium.

© 2018 Market Decipher. All Rights Reserved