Flexible Display Market
By Product (OLED, Electrophoretic display, and Liquid crystal display), By Application (E-paper, E-book reader, and Portable television), By Region (North America, Europe, APAC and Rest of the World)
- Report ID : MD1020 |
- Pages : 192 |
- Tables : 94 |
- Formats :


Flexible display market can experience a significant increase in its revenue during the forecast period due to the increasing use of devices like laptops, smartphones, tablets, and other electronic devices. The improvement in the standards of this technology is making it more portable and environment-friendly. Also, the wide application of this display in the military sector and digital signage can increase its demand in the future as it is available at affordable prices and can be carried easily. Since OLEDs do not require any backlight or filter; they are comparatively lightweight and are thinner than LCDs. They allow the display to roll and fold and in this way, it is inexhaustible and slim by nature. Through the forecast period, the overall flexible displays market revenue is expected to reach $ 164.44 billion. There is no limit on ruggedness, size, and weight in the growing expectations of consumers, which will greatly increase market shares.
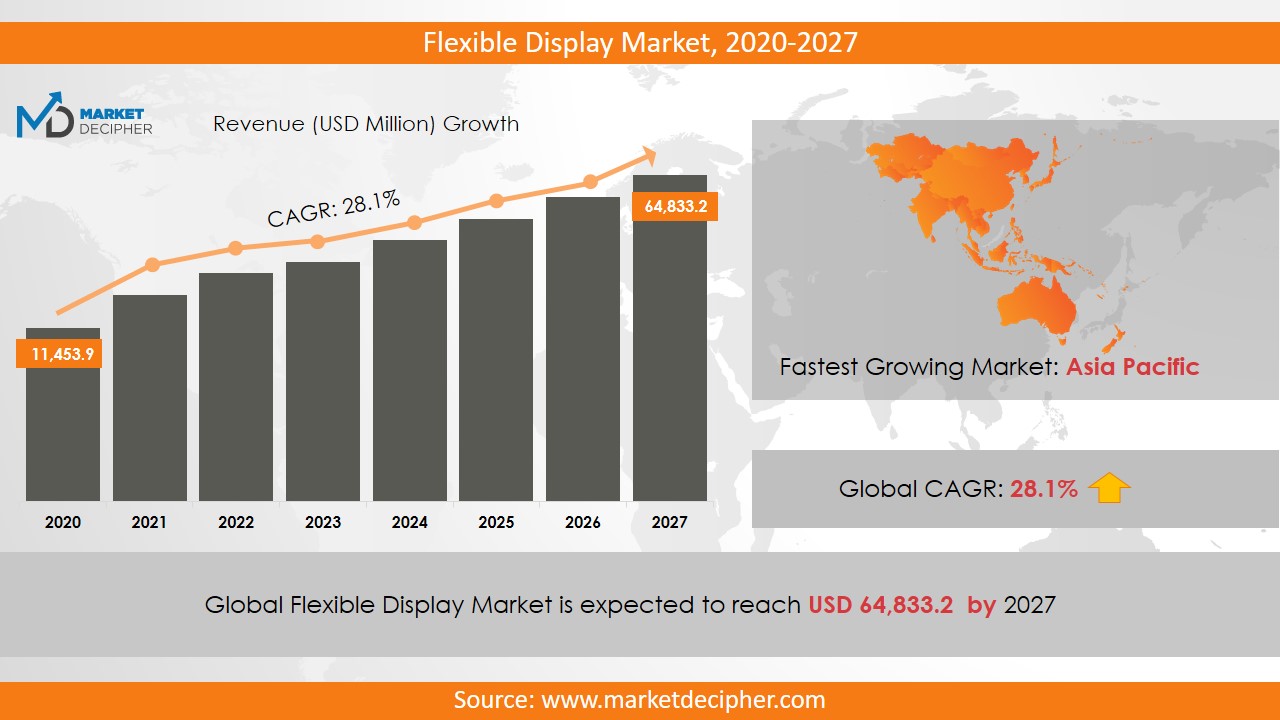
Flexible display market revenue shall reach a value of $36.8 Billion in 2031, growing with a CAGR of 34.2% during the forecast period of 2022 to 2031. In terms of volume sales, the market is anticipated to reach XX Units.
While rolling the display, the force can reduce the efficiency of the device and damage it and the material used in the OLED Flexible display is very sensitive to moisture and air, which disrupts the performance of the device. Thus, it becomes difficult to use it in many different devices and this could hamper the growth of market shares. This industry is expected to earn appreciable profit by major flexible display market trends such as increasing use of video content over the internet and increased use of social media. Further, Automobile industries are constantly adding advanced features to their products, which use flexible display technology. However, there are some complexities in the manufacturing of these displays which could affect the growth of the market. The demands for these displays are mainly raised by the consumer electronics sectors, such as tablets, display screens, and smartphones.
REGIONAL ANALYSIS
Brazil and China have grown up the flexible displays market size up to a significant level due to the increased application of this technology in these regions. Asia Pacific region also contributed significantly to the augmentation of the market revenue. Developed countries have invested a lot for flexible displays because in these areas the government supports the adoption of advanced technology in diverse fields. Owing to a large number of smartphone industries in Germany, U.S, and U.K, Europe and North America are expected to drive the demand for these displays significantly over the forecast period. Latin America is expected to grow its market significantly owing to the increasing electronics sales.
SEGMENT ANALYSIS
In terms of application, the segmentation has been done as the E-Paper and E-book reader and Potable television. By product, the flexible displays market report provides exclusive analysis of as Organic light emitting diode, Electrophoretic display, and Liquid crystal display. Organic light emitting diode (OLED) has contributed significantly to propelling the market growth as the OLED display has many advantages. They provide attractive features like wide and High Definition Picture Quality compared to other displays. However, they are a bit expensive too. But after acceptance by consumers, their costs are anticipated to decrease.
INDUSTRY PLAYER ANALYSIS
Major industry players have been analyzed with coverage on their operating areas, revenues, and other strategic aspects. These industry players’ include Philips Electronics, L.G Display Corporation limited, Materion Corporation, HP Company, DuPont Display, Sony Corporation, Corning Incorporated, Atmel Corporation, Polymer Display, Kent Display, and Samsung Display. Industry players will soon be overcoming all the drawbacks of these displays in the coming years as the producers are working on them. Other industries in this domain that is growing at a high CAGR include Flexible Substrates Market and Barrier Films Flexible Electronics Market.
COVERAGE HIGHLIGHTS
Revenue Estimation and Forecast (2022 – 2031)
Production Estimation and Forecast (2022 – 2031)
Sales/Consumption Volume Estimation and Forecast (2022 – 2031)
Breakdown of Revenue by Segments (2022 – 2031)
Breakdown of Production by Segments (2022 – 2031)
Breakdown of Sales Volume by Segments (2022 – 2031)
Gross Margin and Profitability Analysis of Companies
Business Trend and Expansion Analysis
Import and Export Analysis
Regional Analysis and Data Breakdown
SEGMENTAL ANALYSIS:
By Product Overview ($Revenue and Unit Sales, 2022-2031)
Organic light emitting diode
Electrophoretic display
Liquid crystal display
By Application Overview ($Revenue and Unit Sales, 2022-2031)
E-Paper
E-book reader
Potable television
By Regional Overview ($Revenue and Unit Sales, 2022-2031)
North America
Mexico
U.S
Canada
Europe
U.K
Germany
U.S
Asia-Pacific
India
Thailand
China
Rest of the World
Middle East
Africa
Latin America
Need Report on a particular Country OR need a Tailored/Customized Research? Budget Limits/Price Discounts Query...!
Email to David Correa
OR Fill the below "Sample Request FORM" with your queries in the message box.
CHAPTER 1. INTRODUCTION
1.1. RESEARCH METHODOLOGY
1.1.1. Data Collection
1.1.2. Data Modeling
1.1.3. Historical Revenue and Sales Estimation
1.1.4. Data Triangulation
1.2. RESEARCH PROCESS
1.2.1. Primary Research
1.2.2. Secondary Research
1.2.3. Survey Data
1.2.4. Validation by In-House Expert
1.3. FLEXIBLE DISPLAY MARKET OVERVIEW
1.3.1. Research Scope and Market Definition
1.3.2. Executive Summary
CHAPTER 2. GLOBAL FLEXIBLE DISPLAY MARKET DEMAND SIDE ANALYSIS
2.1. FLEXIBLE DISPLAY MARKET CONSUMPTION VOLUME (BILLION UNITS), 2018 – 2025
2.2. MARKET CONSUMPTION VOLUME SPLIT BY REGION (BILLION UNITS), 2018 – 2025
2.3. MARKET CONSUMPTION VOLUME SPLIT BY COUNTRIES (BILLION UNITS), 2018 – 2025
2.4. MARKET REVENUE (BILLION USD), 2018-2025
2.5. MARKET REVENUE SPLIT BY REGION (BILLION UNITS), 2018 – 2025
2.6. FLEXIBLE DISPLAY MARKET REVENUE SPLIT BY COUNTRIES (BILLION UNITS), 2018 – 2025
CHAPTER 3. GLOBAL FLEXIBLE DISPLAY MARKET SUPPLY SIDE ANALYSIS
3.1. FLEXIBLE DISPLAY MARKET PRODUCTION VOLUME (BILLION UNITS), 2018 – 2025
3.2. MARKET PRODUCTION VOLUME SPLIT BY REGION (BILLION UNITS), 2018-2025
3.3. MARKET PRODUCTION VOLUME SPLIT/RANKING BY COUNTRIES (BILLION UNITS), 2018 – 2025
CHAPTER 4. GLOBAL FLEXIBLE DISPLAY MARKET COMPETITIVE SCENARIO & BUSINESS OPPORTUNITY ANALYSIS
4.1. COMPETITIVE STRENGTH RANKING BY MAJOR COUNTRIES, 2018
4.2. MARKET ATTRACTIVENESS RANKING BY MAJOR COUNTRIES, 2018 - 2025
4.3. EMERGING BUSINESS OPPORTUNITIES AND GROWTH PROSPECTS
4.3.1. Growth Drivers
4.3.2. Market Restraints
4.3.2. Opportunities
CHAPTER 5. GLOBAL FLEXIBLE DISPLAY MARKET ENTRY STRATEGIES
5.1. ENTRY STRATEGIES IN DEVELOPING MARKETS
5.2. ENTRY STRATEGIES IN DEVELOPED MARKETS
CHAPTER 6. GLOBAL FLEXIBLE DISPLAY MARKET BY PRODUCT
6.1. SEGMENT OUTLINE
6.2. REVENUE SHARE BY PRODUCT, $BILLION, 2018 – 2025
6.2. CONSUMPTION SHARE BY PRODUCT, BILLION UNITS, 2018 - 2025
6.3. PRODUCTION SHARE BY PRODUCT, BILLION UNITS, 2018 – 2025
6.4. ORGANIC LIGHT EMITTING DIODE
6.4.1. Market determinants and trend analysis
6.4.2. Market revenue, sales and production volume, 2018 – 2025
6.5. ELECTROPHORETIC DISPLAY
6.5.1. Market determinants and trend analysis
6.5.2. Market revenue, sales and production volume, 2018 – 2025
6.6. LIQUID CRYSTAL DISPLAY
6.6.1. Market determinants and trend analysis
6.6.2. Market revenue, sales and production volume, 2018 – 2025
CHAPTER 7. GLOBAL FLEXIBLE DISPLAY MARKET BY APPLICATION
7.1. SEGMENT OUTLINE
7.2. REVENUE SHARE BY APPLICATION, $BILLION, 2018 – 2025
7.2. CONSUMPTION SHARE BY APPLICATION, BILLION UNITS, 2018 - 2025
7.3. PRODUCTION SHARE BY APPLICATION, BILLION UNITS, 2018 – 2025
7.4. E- PAPER
7.4.1. Market determinants and trend analysis
7.4.2. Market revenue, sales and production volume, 2018 – 2025
7.5. E-BOOK READER
7.5.1. Market determinants and trend analysis
7.5.2. Market revenue, sales and production volume, 2018 – 2025
7.6. POTABLE TELEVISION
7.6.1. Market determinants and trend analysis
7.6.2. Market revenue, sales and production volume, 2018 – 2025
CHAPTER 8. GLOBAL FLEXIBLE DISPLAY MARKET BY REGIONS
8.1. REGIONAL OUTLOOK
8.2. MARKET PRODUCTION, CONSUMPTION & REVENUE BY REGION, 2018-2025
8.3. NORTH AMERICA
8.3.1. Current Trends and Future Prospects
8.3.2. North America market revenue, sales and production volume, 2018 – 2025
8.3.3. U.S.
8.3.3.1. Flexible Display Market Revenue $BILLION (2018 – 2025)
8.3.3.2. Flexible Display Market Consumption BILLION Units (2018 – 2025)
8.3.3.3. Flexible Display Market Production BILLION Units (2018 – 2025)
8.3.4. Canada
8.3.4.1. Flexible Display Market Revenue $BILLION (2018 – 2025)
8.3.4.2. Flexible Display Market Consumption BILLION Units (2018 – 2025)
8.3.4.3. Flexible Display Market Production BILLION Units (2018 – 2025)
8.3.5. Mexico
8.3.5.1. Flexible Display Market Revenue $BILLION (2018 – 2025)
8.3.5.2. Flexible Display Market Consumption BILLION Units (2018 – 2025)
8.3.5.3. Flexible Display Market Production BILLION Units (2018 – 2025)
8.4. EUROPE
8.4.1. Current Trends and Future Prospects
8.4.2. Europe market revenue, sales and production volume, 2018 – 2025
8.4.3. U.K
8.4.3.1. Flexible Display Market Revenue $BILLION (2018 – 2025)
8.4.3.2. Flexible Display Market Consumption BILLION Units (2018 – 2025)
8.4.3.3. Flexible Display Market Production BILLION Units (2018 – 2025)
8.4.4. Germany
8.4.4.1. Flexible Display Market Revenue $BILLION (2018 – 2025)
8.4.4.2. Flexible Display Market Consumption BILLION Units (2018 – 2025)
8.4.4.3. Flexible Display Market Production BILLION Units (2018 – 2025)
8.4.5. France
8.4.5.1. Flexible Display Market Revenue $BILLION (2018 – 2025)
8.4.5.2. Flexible Display Market Consumption BILLION Units (2018 – 2025)
8.4.5.3. Flexible Display Market Production BILLION Units (2018 – 2025)
8.4.6. Italy
8.4.6.1. Flexible Display Market Revenue $BILLION (2018 – 2025)
8.4.6.2. Flexible Display Market Consumption BILLION Units (2018 – 2025)
8.4.6.3. Flexible Display Market Production BILLION Units (2018 – 2025)
8.4.7. Rest of Europe
8.4.7.1. Flexible Display Market Revenue $BILLION (2018 – 2025)
8.4.7.2. Flexible Display Market Consumption BILLION Units (2018 – 2025)
8.4.7.3. Flexible Display Market Production BILLION Units (2018 – 2025)
8.5. ASIA PACIFIC
8.5.1. Current Trends and Future Prospects
8.5.2. Europe market revenue, sales and production volume, 2018 – 2025
8.5.3. India
8.5.3.1. Flexible Display Market Revenue $BILLION (2018 – 2025)
8.5.3.2. Flexible Display Market Consumption BILLION Units (2018 – 2025)
8.5.3.3. Flexible Display Market Production BILLION Units (2018 – 2025)
8.5.4. Japan
8.5.4.1. Flexible Display Market Revenue $BILLION (2018 – 2025)
8.5.4.2. Flexible Display Market Consumption BILLION Units (2018 – 2025)
8.5.4.3. Flexible Display Market Production BILLION Units (2018 – 2025)
8.5.5. China
8.5.5.1. Flexible Display Market Revenue $BILLION (2018 – 2025)
8.5.5.2. Flexible Display Market Consumption BILLION Units (2018 – 2025)
8.5.5.3. Flexible Display Market Production BILLION Units (2018 – 2025)
8.5.6. South Korea
8.5.6.1. Flexible Display Market Revenue $BILLION (2018 – 2025)
8.5.6.2. Flexible Display Market Consumption BILLION Units (2018 – 2025)
8.5.6.3. Flexible Display Market Production BILLION Units (2018 – 2025)
8.5.7. Rest of APAC
8.5.7.1. Flexible Display Market Revenue $BILLION (2018 – 2025)
8.5.7.2. Flexible Display Market Consumption BILLION Units (2018 – 2025)
8.5.7.3. Flexible Display Market Production BILLION Units (2018 – 2025)
8.6. REST OF THE WORLD
8.6.1. Current Trends and Future Prospects
8.6.2. Europe market revenue, sales and production volume, 2018 – 2025
8.6.3. Latin America
8.6.3.1. Flexible Display Market Revenue $BILLION (2018 – 2025)
8.6.3.2. Flexible Display Market Consumption BILLION Units (2018 – 2025)
8.6.3.3. Flexible Display Market Production BILLION Units (2018 – 2025)
8.6.4. Middle East
8.6.4.1. Flexible Display Market Revenue $BILLION (2018 – 2025)
8.6.4.2. Flexible Display Market Consumption BILLION Units (2018 – 2025)
8.6.4.3. Flexible Display Market Production BILLION Units (2018 – 2025)
8.6.5. Africa
8.6.5.1. Flexible Display Market Revenue $BILLION (2018 – 2025)
8.6.5.2. Flexible Display Market Consumption BILLION Units (2018 – 2025)
8.6.5.3. Flexible Display Market Production BILLION Units (2018 – 2025)
CHAPTER 9. KEY VENDOR PROFILES
9.1. Philips Electronics
9.1.1. Company overview
9.1.2. Portfolio Analysis
9.1.3. Estimated revenue from flexible display business and market share
9.1.4. Regional & business segment Revenue Analysis
9.2. L.G Display Corporation limited
9.2.1. Company overview
9.2.2. Portfolio Analysis
9.2.3. Estimated revenue from flexible display business and market share
9.2.4. Regional & business segment Revenue Analysis
9.3. Materion Corporation
9.3.1. Company overview
9.3.2. Portfolio Analysis
9.3.3. Estimated revenue from flexible display business and market share
9.3.4. Regional & business segment Revenue Analysis
9.4. HP Company
9.4.1. Company overview
9.4.2. Portfolio Analysis
9.4.3. Estimated revenue from flexible display business and market share
9.4.4. Regional & business segment Revenue Analysis
9.5. DuPont Display
9.5.1. Company overview
9.5.2. Portfolio Analysis
9.5.3. Estimated revenue from flexible display business and market share
9.5.4. Regional & business segment Revenue Analysis
9.6. Sony Corporation
9.6.1. Company overview
9.6.2. Portfolio Analysis
9.6.3. Estimated revenue from flexible display business and market share
9.6.4. Regional & business segment Revenue Analysis
9.7. Corning Incorporated
9.7.1. Company overview
9.7.2. Portfolio Analysis
9.7.3. Estimated revenue from flexible display business and market share
9.7.4. Regional & business segment Revenue Analysis
9.8. Atmel Corporation
9.8.1. Company overview
9.8.2. Portfolio Analysis
9.8.3. Estimated revenue from flexible display business and market share
9.8.4. Regional & business segment Revenue Analysis
9.9. Polymer Display
9.9.1. Company overview
9.9.2. Portfolio Analysis
9.9.3. Estimated revenue from flexible display business and market share
9.9.4. Regional & business segment Revenue Analysis
9.10. Kent Display and Samsung Display
9.10.1. Company overview
9.10.2. Portfolio Analysis
9.10.3. Estimated revenue from flexible display business and market share
9.10.4. Regional & business segment Revenue Analysis
PURCHASE OPTIONS
20% Free Customization ON ALL PURCHASE
*Terms & Conditions Apply
Looking for report on this market in a particular region or country? Get In Touch
Request Free Sample
Please fill in the form below to Request for free Sample Report
-
Office Hours Mon - Sat 10:00 - 16:00
-
Call Us +91 6201075429
-
Send Us Mail sales@marketdecipher.com
Market Decipher is a market research and consultancy firm involved in provision of market reports to organisations of varied sizes; small, large and medium.

© 2018 Market Decipher. All Rights Reserved