Fumed Silica Market
By Product (Hydrophilic, Hydrophobic), By Application (Pharmaceutical, Beauty & Personal Care, Silicone Elastomers, Paints, Coatings & Inks, UPR, Adhesives & Sealants, Food & Beverages), Industry Analysis Report, Regional Outlook (U.S., Canada, Germany, UK, France, Italy, Spain, Russia, China, India, Japan, Australia, Malaysia, Indonesia, South Korea, Brazil, Mexico, South Africa, Saudi Arabia, UAE, Kuwait)
- Report ID : MD1426 |
- Pages : 240 |
- Tables : 85 |
- Formats :


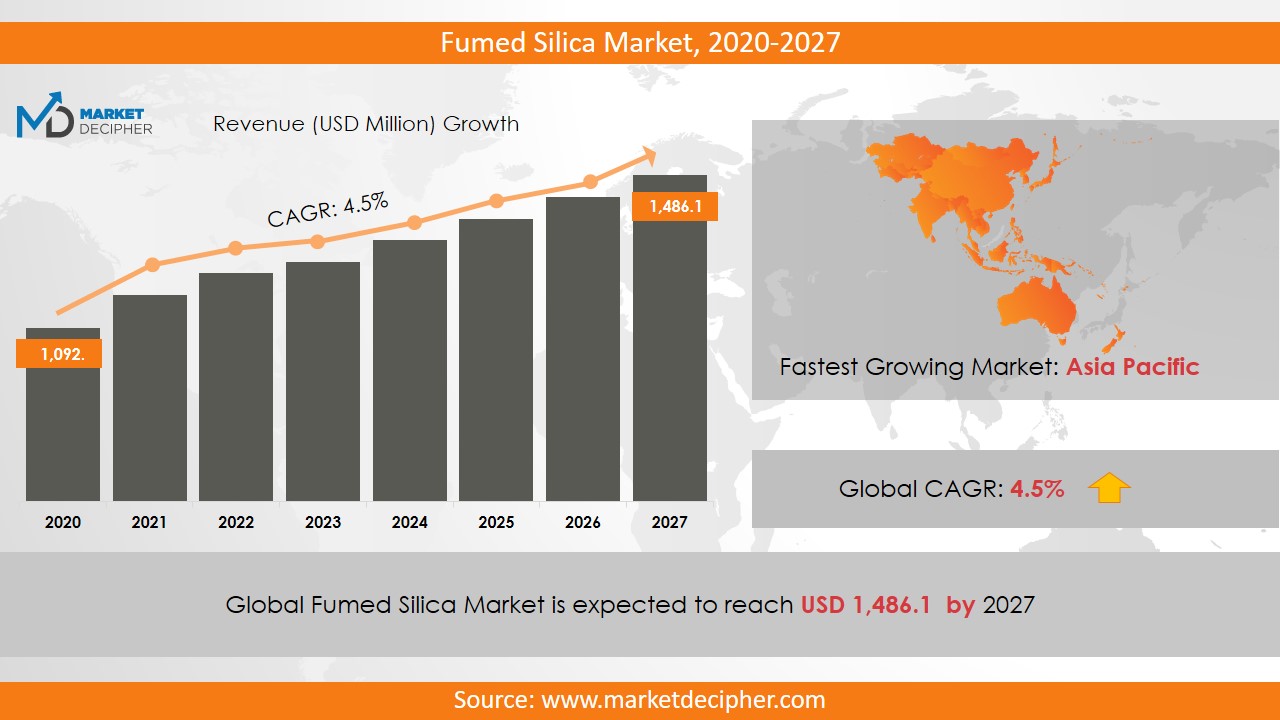
Fumed Silica Market size was estimated at $1,092.1 Million in 2019 and is expected to reach $1,486.1 Million by 2027, growing at a CAGR of 4.5% during the forecast period of 2020 to 2027.
Fumed Silica is a type of silica that finds application in a lot of industries owing to its multifaceted nature. Temperatures of 3,000 o C are used in its production process. A technique known as pyrolysis is used which includes quartz. The particle size varies from 5 – 50 nm and has a low relative density of about 170 kg/m3.
Analysis by Product
Based on product, Fumed Silica can be categorized into two forms: Hydrophobic and Hydrophilic.
They have different affinities with water. Hydrophilic silica shows strong miscibility with water while its Hydrophobic counterpart doesn’t mix with water. The Hydrophilic version is untreated and relatively economical. In the context of this timeframe, Hydrophilic silica is likely to make larger grounds owing to its wide industry demand.
Analysis by Application
Based on application, the market is segmented as follows: Pharmaceutical, Beauty & Personal care, Silicone Elastomers, paints coatings & inks, Unsaturated Polyester Resin, Adhesives & Sealants, Food & Beverages, and others. The “Others” comprise of defoamer, electronics, and plastics.
The Pharmaceutical, Beauty & Personal care segment will witness the largest pull of demand from the suppliers of Fumed Silica. This is because of the sheer variety of products that Fumed Silica finds its way into. These include but are not limited to Tooth Paste, Color Cosmetics, Lipsticks, Foundations, Skincare, and Haircare products. These products are incurring a steady rise in demand from the customers as the income levels are on the rise.
Adhesives and Sealants are also likely to perform very well. This is because of their retail as well as industrial applications.
Analysis by Region
The Asia-Pacific region has a king-sized appetite for Fumed Silica. This is because of the nature of the industries that operate here. The real-estate segment will see enormous activity due to customers’ preference to invest inbuilt properties. This will largely drive the Fumed Silica sales. To name a few, India and China will lead the way in the market capitalization of the product.
On the other side of the globe, North America is showcasing different dynamics. There, the demand is being sought from the Pharmaceutical sector in a major way. Research & Development is being promoted by the Government. Also, some states have allocated sizeable budgets for the development of the Pharma industry. This will help in the momentum of Fumed Silica sales.
Analysis by Market
The leading producers of Fumed Silica are Evonik Industries, Wacker Chemie AG, and Cabot Corporation. The 2nd tier of players are Tokuyama Corporation, Hubei Xingrui Silicon Materials, Kemitura group, OCI Company Limited, and Henan Xunyu Chemical Co. Ltd.
The industry is trending towards boosting production capabilities, strategic alliances, and product differentiation. Some companies are enhancing production rates in Europe. These are referred to as Green-field projects. The other major activity is the joint partnership of two or more companies in the same region that they operate in to get a stranglehold of the demand. These are regional activities and have a medium to long term vision of owning the value chain as the market warms up to the product.
These activities will be visible across the industry as it gears up for the fruitful business opportunity that awaits them.
COVERAGE HIGHLIGHTS
- Market Revenue Estimation and Forecast (2019 – 2026)
- Market Production Estimation and Forecast (2019 – 2026)
- Market Sales/Consumption Volume Estimation and Forecast (2019 – 2026)
- Breakdown of Revenue by Segments (2019 – 2026)
- Breakdown of Production by Segments (2019 – 2026)
- Breakdown of Sales Volume by Segments (2019 – 2026)
- Gross Margin and Profitability Analysis of Companies
- Business Trend and Expansion Analysis
- Import and Export Analysis
- Regional Analysis and Market Data Breakdown
MARKET SEGMENTATION
By Product Outlook ($Revenue and Unit Sales, 2019-2026)
• Hydrophilic
• Hydrophobic
By Application Outlook ($Revenue and Unit Sales, 2019-2026)
• Pharmaceutical
• Beauty & Personal Care
• Silicone Elastomers
• Paints
• Coatings & Inks
• UPR
• Adhesives & Sealants
• Food & Beverages
By Regional Outlook ($Revenue and Unit Sales, 2019-2026)
• U.S.
• Canada
• Germany
• UK
• France
• Italy
• Spain
• Russia
• China
• India
• Japan
• Australia
• Malaysia
• Indonesia
• South Korea
• Brazil
• Mexico
• South Africa
• Saudi Arabia
• UAE
• Kuwait
Market Players
• Evonik Industries AG
• Cabot Corporation
• Wacker Chemie AG
• OCI Company Ltd.
• Tokuyama Corporation
• Kemitura Group
• Orisil
• Hubei Xingrui Silicon Materials Co., Ltd.
• Henan Xunyu Chemical Co., Ltd.
• China-Henan Huamei Chemical Co., Ltd.
• Dongyue Group
• Cabot Sanmar Limited
CHAPTER 1: INTRODUCTION
1.1. RESEARCH METHODOLOGY
1.1.1. Desk Research
1.1.2. Data Synthesis
1.1.3. Data Validation & Market Feedback
1.1.4. Data Sources
CHAPTER 2: EXECUTIVE SUMMARY
2.1. GLOBAL MARKET OUTLOOK
2.2. CORE INSIGHTS –DELIVERY MODEL
2.3. CORE INSIGHTS – FUMED SILICA
2.4. CORE INSIGHTS – SERVICE PROVIDER
2.5. CORE INSIGHTS – GEOGRAPHY
CHAPTER 3: MARKET OVERVIEW
3.1. MARKET DEFINITION AND SCOPE
3.2. KEY FORCES SHAPING THE INDUSTRY
3.2.1. Bargaining Power of Suppliers
3.2.2. Bargaining Power of Buyers
3.2.3. Threat of Substitutes
3.2.4. Threat of New Entrants
3.3. MARKET DYNAMICS
3.3.1. Drivers
3.3.1.1. Supply-side Drivers
3.3.1.2. Demand-side Drivers
3.3.2. Restraints
3.3.3. Opportunities
3.4. INDUSTRY - ANALYSIS
3.4.1. Political Market
3.4.2. Environmental Market
3.4.3. Social Market
3.4.4. Technology Market
CHAPTER 4: MARKET BACKGROUND
4.1. Industry Value Chain Analysis
4.1.1. Upstream Participants
4.1.2. Downstream participants
4.2. Pricing Analysis and Forecast, 2019-2026
4.2.1. By Type
4.2.2. By Region
CHAPTER 5: FUMED SILICA MARKET, By Product Outlook
5.1. Overview
5.1.1. Market Revenue (US$ Million) and Forecast, 2019-2026
5.2. Hydrophilic
5.2.1. Key Market Trends, Growth Factors and Opportunities
5.2.2. Market Revenue (US$ Million) and Forecast, By Region
5.3. Hydrophobic
5.3.1. Key Market Trends, Growth Factors and Opportunities
5.3.2. Market Revenue (US$ Million) and Forecast, By Region
CHAPTER 6: FUMED SILICA MARKET BY APPLICATION OUTLOOK
6.1. Overview
6.1.1. Market Revenue (US$ Million) and Forecast, 2019-2026
6.2. Pharmaceutical
6.2.1. Key Market Trends, Growth Factors and Opportunities
6.2.2. Market Revenue (US$ Million) and Forecast, By Region
6.3. Beauty & Personal Care
6.3.1. Key Market Trends, Growth Factors and Opportunities
6.3.2. Market Revenue (US$ Million) and Forecast, By Region
6.4. Silicone Elastomers
6.4.1. Key Market Trends, Growth Factors and Opportunities
6.4.2. Market Revenue (US$ Million) and Forecast, By Region
6.5. Paints
6.5.1. Key Market Trends, Growth Factors and Opportunities
6.5.2. Market Revenue (US$ Million) and Forecast, By Region
6.6. Coatings & Inks
6.6.1. Key Market Trends, Growth Factors and Opportunities
6.6.2. Market Revenue (US$ Million) and Forecast, By Region
6.7. UPR
6.7.1. Key Market Trends, Growth Factors and Opportunities
6.7.2. Market Revenue (US$ Million) and Forecast, By Region
6.8. Adhesives & Sealants
6.8.1. Key Market Trends, Growth Factors and Opportunities
6.8.2. Market Revenue (US$ Million) and Forecast, By Region
6.9. Food & Beverages
6.9.1. Key Market Trends, Growth Factors and Opportunities
6.9.2. Market Revenue (US$ Million) and Forecast, By Region
CHAPTER 7: FUMED SILICA, BY GEOGRAPHY
7.1. Overview
7.2. North America
7.2.1. Key Market Trends, Growth Factors and Opportunities
7.2.2. Market Revenue and Forecast, By Delivery Model
7.2.3. Market Revenue and Forecast, By Agriculture Type
7.2.4. Market Revenue and Forecast, By Service Provider
7.2.5. Market Revenue and Forecast, By Country
7.2.6. U.S.
7.2.6.1. Market Revenue and Forecast
7.2.7. Canada
7.2.7.1. Market Revenue and Forecast
7.2.8. Mexico
7.2.8.1. Market Revenue and Forecast
7.3. Europe
7.3.1. Market Revenue and Forecast, By Delivery Model
7.3.2. Market Revenue and Forecast, By Agriculture Type
7.3.3. Market Revenue and Forecast, By Service Provider
7.3.4. Market Revenue and Forecast, By Country
7.3.5. Germany
7.3.5.1. Market Revenue and Forecast
7.3.6. UK
7.3.6.1. Market Revenue and Forecast
7.3.7. France
7.3.7.1. Market Revenue and Forecast
7.3.8. Italy
7.3.8.1. Market Revenue and Forecast
7.3.9. Spain
7.3.9.1. Market Revenue and Forecast
7.3.10. Poland
7.3.10.1. Market Revenue and Forecast
7.3.11. Austrai
7.3.11.1. Market Revenue and Forecast
7.3.12. Luxembourg
7.3.12.1. Market Revenue and Forecast
7.3.13. Rest of Europe
7.3.13.1. Market Revenue and Forecast
7.4. Asia-Pacific
7.4.1. Market Revenue and Forecast, By Delivery Model
7.4.2. Market Revenue and Forecast, By Agriculture Type
7.4.3. Market Revenue and Forecast, By Service Provider
7.4.4. Market Revenue and Forecast, By Country
7.4.5. China
7.4.5.1. Market Revenue and Forecast
7.4.6. India
7.4.6.1. Market Revenue and Forecast
7.4.7. Japan
7.4.7.1. Market Revenue and Forecast
7.4.8. South Korea
7.4.8.1. Market Revenue and Forecast
7.4.9. Rest of APAC
7.4.9.1. Market Revenue and Forecast
7.5. REST OF THE WORLD
7.5.1. Market Revenue and Forecast, By Delivery Model
7.5.2. Market Revenue and Forecast, By Agriculture Type
7.5.3. Market Revenue and Forecast, By Service Provider
7.5.4. Market Revenue and Forecast, By Country
7.5.5. Latin America
7.5.5.1. Market Revenue and Forecast
7.5.6. Middle East
7.5.6.1. Market Revenue and Forecast
7.5.7. Africa
7.5.7.1. Market Revenue and Forecast
CHAPTER 8: COMPETITIVE MARKET
8.1. FUMED SILICA Market Share Analysis, 2019
CHAPTER 9: COMPANY PROFILES
9.1. Airbus S.A.S
9.1.1. Company Overview
9.1.2. Financial Performance
9.1.3. SWOT Analysis
9.2. Aviation Industry Corporation of China Ltd. (AVIC)
9.2.1. Company Overview
9.2.2. Financial Performance
9.2.3. SWOT Analysis
9.3. Astronics Corporation
9.3.1. Company Overview
9.3.2. Financial Performance
9.3.3. SWOT Analysis
9.4. Boeing
9.4.1. Company Overview
9.4.2. Financial Performance
9.4.3. SWOT Analysis
9.5. Ball Corporation
9.5.1. Company Overview
9.5.2. Financial Performance
9.5.3. SWOT Analysis
9.6. BAE Systems
9.6.1. Company Overview
9.6.2. Financial Performance
9.6.3. SWOT Analysis
9.7. Cobham plc
9.7.1. Company Overview
9.7.2. Financial Performance
9.7.3. SWOT Analysis
9.8. Curtiss Wright
9.8.1. Company Overview
9.8.2. Financial Performance
9.8.3. SWOT Analysis
9.9. Elbit System
9.9.1. Company Overview
9.9.2. Financial Performance
9.9.3. SWOT Analysis
9.10. Gramin Ltd
9.10.1. Company Overview
9.10.2. Financial Performance
9.10.3. SWOT Analysis
9.11. GE Aviation
9.11.1. Company Overview
9.11.2. Financial Performance
9.11.3. SWOT Analysis
9.12. Harris Corporation
9.12.1. Company Overview
9.12.2. Financial Performance
9.12.3. SWOT Analysis
9.13. Honeywell International Inc.
9.13.1. Company Overview
9.13.2. Financial Performance
9.13.3. SWOT Analysis
9.14. Lockheed Martin Corporation
9.14.1. Company Overview
9.14.2. Financial Performance
9.14.3. SWOT Analysis
9.15. L3 Harris Corporation
9.15.1. Company Overview
9.15.2. Financial Performance
9.15.3. SWOT Analysis
9.16. Meggitt PLC
9.16.1. Company Overview
9.16.2. Financial Performance
9.16.3. SWOT Analysis
9.17. Northrop Grumman Corporation
9.17.1. Company Overview
9.17.2. Financial Performance
9.17.3. SWOT Analysis
9.18. Nucon Aerospace
9.18.1. Company Overview
9.18.2. Financial Performance
9.18.3. SWOT Analysis
9.19. Panasonic Corporation
9.19.1. Company Overview
9.19.2. Financial Performance
9.19.3. SWOT Analysis
9.20. Rolls Royce
9.20.1. Company Overview
9.20.2. Financial Performance
9.20.3. SWOT Analysis
9.21. Raytheon Company
9.21.1. Company Overview
9.21.2. Financial Performance
9.21.3. SWOT Analysis
9.22. Saab AB
9.22.1. Company Overview
9.22.2. Financial Performance
9.22.3. SWOT Analysis
9.23. Safran
9.23.1. Company Overview
9.23.2. Financial Performance
9.23.3. SWOT Analysis
9.24. Thales Group
9.24.1. Company Overview
9.24.2. Financial Performance
9.24.3. SWOT Analysis
9.25. Teledyne Technologies Inc.
9.25.1. Company Overview
9.25.2. Financial Performance
9.25.3. SWOT Analysis
9.26. Transdigm Group Inc.
9.26.1. Company Overview
9.26.2. Financial Performance
9.26.3. SWOT Analysis
PURCHASE OPTIONS
20% Free Customization ON ALL PURCHASE
*Terms & Conditions Apply
Looking for report on this market in a particular region or country? Get In Touch
Request Free Sample
Please fill in the form below to Request for free Sample Report
-
Office Hours Mon - Sat 10:00 - 16:00
-
Call Us +91 6201075429
-
Send Us Mail sales@marketdecipher.com
Market Decipher is a market research and consultancy firm involved in provision of market reports to organisations of varied sizes; small, large and medium.

© 2018 Market Decipher. All Rights Reserved