Gas Engine Market
By Type (Special gas and Natural Gas), By Power Output (0.5 MW–1 MW, 1 MW–2 MW, 2 MW–5 MW, 5 MW–10 MW, and 10 MW–20 MW), By Application (Cogeneration, Power generation and Mechanical drive), By End-Use (Oil and gas, Utilities and Manufacturing industries), By Region (North America, Europe, APAC and Rest of the World)
- Report ID : MD1161 |
- Pages : 193 |
- Tables : 84 |
- Formats :


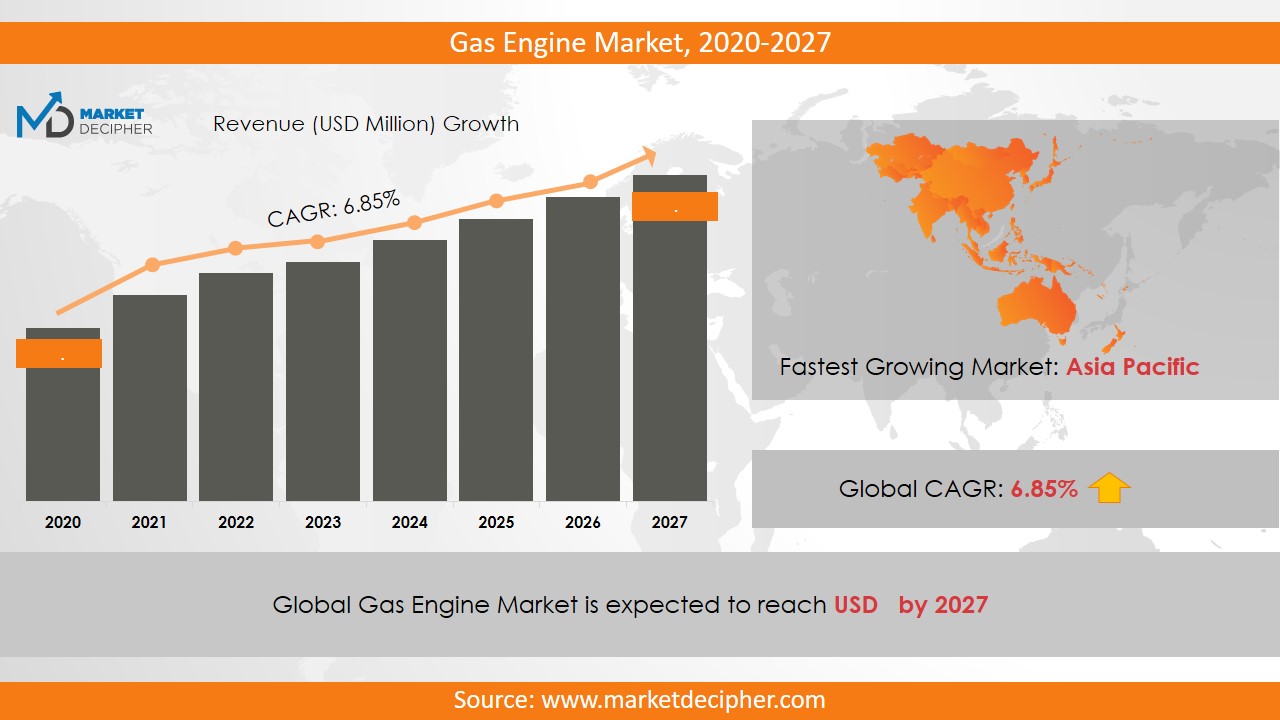
Gas Engine market revenue shall reach a value of $4.42 Billion in 2025, growing with a CAGR of 7.1% during the forecast period of 2019 to 2026. In terms of volume sales, the market is anticipated to reach XX Units.
This market is gaining acceptance all over the world owing to the increasing necessity of reducing air pollution. The increasing development of the industrial and commercial sectors are anticipated to augment the revenue of the market significantly over the forecast period. Further, increasing urbanization and industrialization are the key factors contributing to enhancing market growth. The increasing demand for gas based machinery and automobiles is contributing significantly to augmenting the growth of the market revenue significant over the last few years. Moreover, the strict government rules and regulations for controlling air pollution is anticipated to fuel up the market revenue significantly over the forecast period. Further, the rising demand for the gas engines in the power generation industries is anticipated to propel the market revenue significantly over the forecast period. Moreover, the enhanced features of the gas engines such as high work performance and high fuel efficiency are attracting the market players to invest in the market and thereby leading to heavy competition among the market players which in turn is anticipated to augment the market revenue significantly over the forecast period.
REGIONAL ANALYSIS
The Asia Pacific region is the dominant region in contributing to market growth in 2018. The rising investment by the market players of the region is driving the revenue of the market in the region. Further, this region is anticipated to fuel up the market revenue significantly over the forecast period owing to the rising development of the commercial sector. Further, the growth of the market in the region is also attributed to the development of the construction industries. Moreover, the North America region is also anticipated to grow significantly over the forecast period owing to the heavy competition among the market players in these regions.
SEGMENT ANALYSIS
On the basis of type, the market has been segmented as special gas and natural gas. Further, the special gas segment is anticipated to grow at the fastest rate over the forecast period. Gas engines between 5 MW and 20 MW use natural gas. Apart from this, the demand for biogas has been increasing significantly during the forecast period. Further, by application, the market has been segmented as cogeneration, power generation, and mechanical drive. Gas engines are suitable for grid support, base load, joint cycle, peak shaving, and distributed power generation applications. Due to the growing demand for global power, the power generation segment dominates the market in terms of revenue. The co-generation applications segment is expected to grow with the highest CAGR during the forecast period. Out of which, the power generation segment has dominated the market revenue in 2018. On the basis of end-use, the market has been segmented as oil and gas, utilities and manufacturing industries.
MARKET PLAYER ANALYSIS
Major market players have been analyzed with coverage on their operating areas, revenues, and other strategic aspects. These market players include Caterpillar Inc., Wärtsilä Corporation, Rolls-Royce Holdings plc, Cummins Inc., Mitsubishi Heavy Industries Ltd., General Electric Company, Kawasaki Heavy Industries, Ltd., Hyundai Heavy Industries Co Ltd, Man SE, JFE Engineering Corporation and Liebherr Group.
COVERAGE HIGHLIGHTS
• Market Revenue Estimation and Forecast (2018 – 2025)
• Market Production Estimation and Forecast (2018 – 2025)
• Market Sales/Consumption Volume Estimation and Forecast (2018 – 2025)
• Breakdown of Revenue by Segments (2018 – 2025)
• Breakdown of Production by Segments (2018 – 2025)
• Breakdown of Sales Volume by Segments (2018 – 2025)
• Gross Margin and Profitability Analysis of Companies
• Business Trend and Expansion Analysis
• Import and Export Analysis
• Regional Analysis and Market Data Breakdown
MARKET SEGMENTATION
By Type Outlook ($Revenue and Unit Sales, 2018-2025)
• Special Gas
• Natural Gas
By Application Outlook ($Revenue and Unit Sales, 2018-2025)
• Cogeneration
• Power generation
• Mechanical Drive
By Power Output Outlook ($Revenue and Unit Sales, 2018-2025)
• 0.5 MW–1 MW
• 1 MW–2 MW
• 2 MW–5 MW
• 5 MW–10 MW
• 10 MW–20 MW
By End Use Outlook ($Revenue and Unit Sales, 2018-2025)
• Oil and gas
• Utilities
• Manufacturing
By Regional Outlook ($Revenue and Unit Sales, 2018-2025)
• North America
• Canada
• U.S
• Mexico
• Europe
• Germany
• U.K
• France
• Netherlands
• Austria
• Rest of Europe
• Asia-Pacific
• China
• India
• Japan
• South Korea
• Australia
• Rest of Asia Pacific
• The Middle East and Africa
• Saudi Arabia
• United Arab Emirates
• Rest of Middle East
• Africa
• South America
• Brazil
• Argentina
• Rest of South America
Market Players
• Caterpillar Inc.
• Wärtsilä Corporation
• Rolls-Royce Holdings Plc
• Cummins Inc.
• Mitsubishi Heavy Industries Ltd.
• General Electric Company
• Kawasaki Heavy Industries, Ltd.
• Hyundai Heavy Industries Co Ltd
• Man SE
• JFE Engineering Corporation
• Liebherr Group
CHAPTER 1. INTRODUCTION
1.1. RESEARCH METHODOLOGY
1.1.1. Data Collection
1.1.2. Data Modeling
1.1.3. Historical Revenue and Sales Estimation
1.1.4. Data Triangulation
1.2. RESEARCH PROCESS
1.2.1. Primary Research
1.2.2. Secondary Research
1.2.3. Survey Data
1.2.4. Validation by In-House Expert
1.3. Gas Engine MARKET OVERVIEW
1.3.1. Research Scope and Market Definition
1.3.2. Executive Summary
CHAPTER 2. GLOBAL Gas Engine MARKET DEMAND SIDE ANALYSIS
2.1. Gas Engine MARKET CONSUMPTION VOLUME (BILLION UNITS), 2018 – 2025
2.2. MARKET CONSUMPTION VOLUME SPLIT BY REGION (BILLION UNITS), 2018 – 2025
2.3. MARKET CONSUMPTION VOLUME SPLIT BY COUNTRIES (BILLION UNITS), 2018 – 2025
2.4. MARKET REVENUE (BILLION USD), 2018-2025
2.5. MARKET REVENUE SPLIT BY REGION (BILLION UNITS), 2018 – 2025
2.6. Gas Engine MARKET REVENUE SPLIT BY COUNTRIES (BILLION UNITS), 2018 – 2025
CHAPTER 3. GLOBAL Gas Engine MARKET SUPPLY SIDE ANALYSIS
3.1. Gas Engine MARKET PRODUCTION VOLUME (BILLION UNITS), 2018 – 2025
3.2. MARKET PRODUCTION VOLUME SPLIT BY REGION (BILLION UNITS), 2018-2025
3.3. MARKET PRODUCTION VOLUME SPLIT/RANKING BY COUNTRIES (BILLION UNITS), 2018 – 2025
CHAPTER 4. GLOBAL Gas Engine MARKET COMPETITIVE SCENARIO & BUSINESS OPPORTUNITY ANALYSIS
4.1. COMPETITIVE STRENGTH RANKING BY MAJOR COUNTRIES, 2018
4.2. MARKET ATTRACTIVENESS RANKING BY MAJOR COUNTRIES, 2018 - 2025
4.3. EMERGING BUSINESS OPPORTUNITIES AND GROWTH PROSPECTS
4.3.1. Growth Drivers
4.3.2. Market Restraints
4.3.2. Opportunities
CHAPTER 5. GLOBAL Gas Engine MARKET ENTRY STRATEGIES
5.1. ENTRY STRATEGIES IN DEVELOPING MARKETS
5.2. ENTRY STRATEGIES IN DEVELOPED MARKETS
CHAPTER 6. GLOBAL Gas Engine MARKET BY TYPE
6.1. SEGMENT OUTLINE
6.2. REVENUE SHARE BY TYPE, $BILLION, 2018 – 2025
6.2. CONSUMPTION SHARE BY TYPE, BILLION UNITS, 2018 - 2025
6.3. PRODUCTION SHARE BY TYPE, BILLION UNITS, 2018 – 2025
6.4. SPECIAL GAS
6.4.1. Market determinants and trend analysis
6.4.2. Market revenue, sales and production volume, 2018 – 2025
6.5. NATURAL GAS
6.5.1. Market determinants and trend analysis
6.5.2. Market revenue, sales and production volume, 2018 – 2025
CHAPTER 7. GLOBAL Gas Engine MARKET BY APPLICATION
7.1. SEGMENT OUTLINE
7.2. REVENUE SHARE BY APPLICATION, $BILLION, 2018 – 2025
7.2. CONSUMPTION SHARE BY APPLICATION, BILLION UNITS, 2018 - 2025
7.3. PRODUCTION SHARE BY APPLICATION, BILLION UNITS, 2018 – 2025
7.4. CO- GENERATION
7.4.1. Market determinants and trend analysis
7.4.2. Market revenue, sales and production volume, 2018 – 2025
7.5. POWER GENERATION
7.5.1. Market determinants and trend analysis
7.5.2. Market revenue, sales and production volume, 2018 – 2025
7.6. MECHANICAL DRIVE
7.6.1. Market determinants and trend analysis
7.6.2. Market revenue, sales and production volume, 2018 – 2025
CHAPTER 8. GLOBAL Gas Engine MARKET BY POWER OUTPUT
8.1. SEGMENT OUTLINE
8.2. REVENUE SHARE BY POWER OUTPUT, $BILLION, 2018 – 2025
8.2. CONSUMPTION SHARE BY POWER OUTPUT, BILLION UNITS, 2018 - 2025
8.3. PRODUCTION SHARE BY POWER OUTPUT, BILLION UNITS, 2018 – 2025
8.4. 0.5 MW–1 MW
8.4.1. Market determinants and trend analysis
8.4.2. Market revenue, sales and production volume, 2018 – 2025
8.5. 1 MW–2 MW
8.5.1. Market determinants and trend analysis
8.5.2. Market revenue, sales and production volume, 2018 – 2025
8.6. 2 MW–5 MW
8.6.1. Market determinants and trend analysis
8.6.2. Market revenue, sales and production volume, 2018 – 2025
8.7. 5 MW–10 MW
8.7.1. Market determinants and trend analysis
8.7.2. Market revenue, sales and production volume, 2018 – 2025
8.8. 10 MW–20 MW
8.8.1. Market determinants and trend analysis
8.8.2. Market revenue, sales and production volume, 2018 – 2025
CHAPTER 9. GLOBAL Gas Engine MARKET BY END USE
9.1. SEGMENT OUTLINE
9.2. REVENUE SHARE BY END USE, $BILLION, 2018 – 2025
9.2. CONSUMPTION SHARE BY END USE, BILLION UNITS, 2018 - 2025
9.3. PRODUCTION SHARE BY END USE, BILLION UNITS, 2018 – 2025
9.4. OIL AND GAS
9.4.1. Market determinants and trend analysis
9.4.2. Market revenue, sales and production volume, 2018 – 2025
9.5. UTILITIES
9.5.1. Market determinants and trend analysis
9.5.2. Market revenue, sales and production volume, 2018 – 2025
9.6. MANUFACTURING
9.6.1. Market determinants and trend analysis
9.6.2. Market revenue, sales and production volume, 2018 – 2025
CHAPTER 10. GLOBAL Gas Engine MARKET BY REGIONS
10.1. REGIONAL OUTLOOK
10.2. MARKET PRODUCTION, CONSUMPTION & REVENUE BY REGION, 2018-2025
10.3. NORTH AMERICA
10.3.1. Current Trends and Future Prospects
10.3.2. North America market revenue, sales and production volume, 2018 – 2025
10.3.3. U.S.
10.3.3.1. Gas Engine Market Revenue $BILLION (2018 – 2025)
10.3.3.2. Gas Engine Market Consumption BILLION Units (2018 – 2025)
10.3.3.3. Gas Engine Market Production BILLION Units (2018 – 2025)
10.3.4. Canada
10.3.4.1. Gas Engine Market Revenue $BILLION (2018 – 2025)
10.3.4.2. Gas Engine Market Consumption BILLION Units (2018 – 2025)
10.3.4.3. Gas Engine Market Production BILLION Units (2018 – 2025)
10.3.5. Mexico
10.3.5.1. Gas Engine Market Revenue $BILLION (2018 – 2025)
10.3.5.2. Gas Engine Market Consumption BILLION Units (2018 – 2025)
10.3.5.3. Gas Engine Market Production BILLION Units (2018 – 2025)
10.4. EUROPE
10.4.1. Current Trends and Future Prospects
10.4.2. Europe market revenue, sales and production volume, 2018 – 2025
10.4.3. U.K
10.4.3.1. Gas Engine Market Revenue $BILLION (2018 – 2025)
10.4.3.2. Gas Engine Market Consumption BILLION Units (2018 – 2025)
10.4.3.3. Gas Engine Market Production BILLION Units (2018 – 2025)
10.4.4. Germany
10.4.4.1. Gas Engine Market Revenue $BILLION (2018 – 2025)
10.4.4.2. Gas Engine Market Consumption BILLION Units (2018 – 2025)
10.4.4.3. Gas Engine Market Production BILLION Units (2018 – 2025)
10.4.5. France
10.4.5.1. Gas Engine Market Revenue $BILLION (2018 – 2025)
10.4.5.2. Gas Engine Market Consumption BILLION Units (2018 – 2025)
10.4.5.3. Gas Engine Market Production BILLION Units (2018 – 2025)
10.4.6. Italy
10.4.6.1. Gas Engine Market Revenue $BILLION (2018 – 2025)
10.4.6.2. Gas Engine Market Consumption BILLION Units (2018 – 2025)
10.4.6.3. Gas Engine Market Production BILLION Units (2018 – 2025)
10.4.7. Rest of Europe
10.4.7.1. Gas Engine Market Revenue $BILLION (2018 – 2025)
10.4.7.2. Gas Engine Market Consumption BILLION Units (2018 – 2025)
10.4.7.3. Gas Engine Market Production BILLION Units (2018 – 2025)
10.5. ASIA PACIFIC
10.5.1. Current Trends and Future Prospects
10.5.2. Europe market revenue, sales and production volume, 2018 – 2025
10.5.3. India
10.5.3.1. Gas Engine Market Revenue $BILLION (2018 – 2025)
10.5.3.2. Gas Engine Market Consumption BILLION Units (2018 – 2025)
10.5.3.3. Gas Engine Market Production BILLION Units (2018 – 2025)
10.5.4. Japan
10.5.4.1. Gas Engine Market Revenue $BILLION (2018 – 2025)
10.5.4.2. Gas Engine Market Consumption BILLION Units (2018 – 2025)
10.5.4.3. Gas Engine Market Production BILLION Units (2018 – 2025)
10.5.5. China
10.5.5.1. Gas Engine Market Revenue $BILLION (2018 – 2025)
10.5.5.2. Gas Engine Market Consumption BILLION Units (2018 – 2025)
10.5.5.3. Gas Engine Market Production BILLION Units (2018 – 2025)
10.5.6. South Korea
10.5.6.1. Gas Engine Market Revenue $BILLION (2018 – 2025)
10.5.6.2. Gas Engine Market Consumption BILLION Units (2018 – 2025)
10.5.6.3. Gas Engine Market Production BILLION Units (2018 – 2025)
10.5.7. Rest of APAC
10.5.7.1. Gas Engine Market Revenue $BILLION (2018 – 2025)
10.5.7.2. Gas Engine Market Consumption BILLION Units (2018 – 2025)
10.5.7.3. Gas Engine Market Production BILLION Units (2018 – 2025)
10.6. REST OF THE WORLD
10.6.1. Current Trends and Future Prospects
10.6.2. Europe market revenue, sales and production volume, 2018 – 2025
10.6.3. Latin America
10.6.3.1. Gas Engine Market Revenue $BILLION (2018 – 2025)
10.6.3.2. Gas Engine Market Consumption BILLION Units (2018 – 2025)
10.6.3.3. Gas Engine Market Production BILLION Units (2018 – 2025)
10.6.4. Middle East
10.6.4.1. Gas Engine Market Revenue $BILLION (2018 – 2025)
10.6.4.2. Gas Engine Market Consumption BILLION Units (2018 – 2025)
10.6.4.3. Gas Engine Market Production BILLION Units (2018 – 2025)
10.6.5. Africa
10.6.5.1. Gas Engine Market Revenue $BILLION (2018 – 2025)
10.6.5.2. Gas Engine Market Consumption BILLION Units (2018 – 2025)
10.6.5.3. Gas Engine Market Production BILLION Units (2018 – 2025)
CHAPTER 11. KEY VENDOR PROFILES
11.1. Caterpillar Inc.
11.1.1. Company overview
11.1.2. Portfolio Analysis
11.1.3. Estimated revenue from gas engine business and market share
11.1.4. Regional & business segment Revenue Analysis
11.2. Wärtsilä Corporation
11.2.1. Company overview
11.2.2. Portfolio Analysis
11.2.3. Estimated revenue from gas engine business and market share
11.2.4. Regional & business segment Revenue Analysis
11.3. Rolls-Royce Holdings plc
11.3.1. Company overview
11.3.2. Portfolio Analysis
11.3.3. Estimated revenue from gas engine business and market share
11.3.4. Regional & business segment Revenue Analysis
11.4. Cummins Inc.
11.4.1. Company overview
11.4.2. Portfolio Analysis
11.4.3. Estimated revenue from gas engine business and market share
11.4.4. Regional & business segment Revenue Analysis
11.5. Mitsubishi Heavy Industries Ltd.
11.5.1. Company overview
11.5.2. Portfolio Analysis
11.5.3. Estimated revenue from gas engine business and market share
11.5.4. Regional & business segment Revenue Analysis
11.6. General Electric Company
11.6.1. Company overview
11.6.2. Portfolio Analysis
11.6.3. Estimated revenue from gas engine business and market share
11.6.4. Regional & business segment Revenue Analysis
11.7. Kawasaki Heavy Industries, Ltd.
11.7.1. Company overview
11.7.2. Portfolio Analysis
11.7.3. Estimated revenue from gas engine business and market share
11.7.4. Regional & business segment Revenue Analysis
11.8. Hyundai Heavy Industries Co Ltd
11.8.1. Company overview
11.8.2. Portfolio Analysis
11.8.3. Estimated revenue from gas engine business and market share
11.8.4. Regional & business segment Revenue Analysis
11.9. Man SE
11.9.1. Company overview
11.9.2. Portfolio Analysis
11.9.3. Estimated revenue from gas engine business and market share
11.9.4. Regional & business segment Revenue Analysis
11.10. JFE Engineering Corporation
11.10.1. Company overview
11.10.2. Portfolio Analysis
11.10.3. Estimated revenue from gas engine business and market share
11.10.4. Regional & business segment Revenue Analysis
11.11. Liebherr Group
11.11.1. Company overview
11.11.2. Portfolio Analysis
11.11.3. Estimated revenue from gas engine business and market share
11.11.4. Regional & business segment Revenue Analysis
PURCHASE OPTIONS
20% Free Customization ON ALL PURCHASE
*Terms & Conditions Apply
Looking for report on this market in a particular region or country? Get In Touch
Request Free Sample
Please fill in the form below to Request for free Sample Report
-
Office Hours Mon - Sat 10:00 - 16:00
-
Call Us +91 6201075429
-
Send Us Mail sales@marketdecipher.com
Market Decipher is a market research and consultancy firm involved in provision of market reports to organisations of varied sizes; small, large and medium.

© 2018 Market Decipher. All Rights Reserved