Global Visualization & 3D Rendering Software Market Report 2019 – 2026, Sales Volume, Revenue, Growth Trend and Estimation Forecast
Global Visualization & 3D Rendering Software by Product (Plugin, and Stand-Alone) By Deployment Model (Cloud, and On-Premise) By Application (Gaming, Marketing & Advertisement, Videography, Research & Training, and Cartoon) By End User (Construction & Real Estate, Media & Entertainment, Education, Energy & Utility, Healthcare & Life Science, and Others) By Region (North America, Europe, APAC, MEA and Latin America)
- Report ID : MD1346 |
- Pages : 215 |
- Tables : 84 |
- Formats :


Visualization & 3D Rendering Software Market revenue is estimated to be $USD Billion in 2018 and shall grow with a CAGR of XX.X% the forecast period of 2018 to 2026.
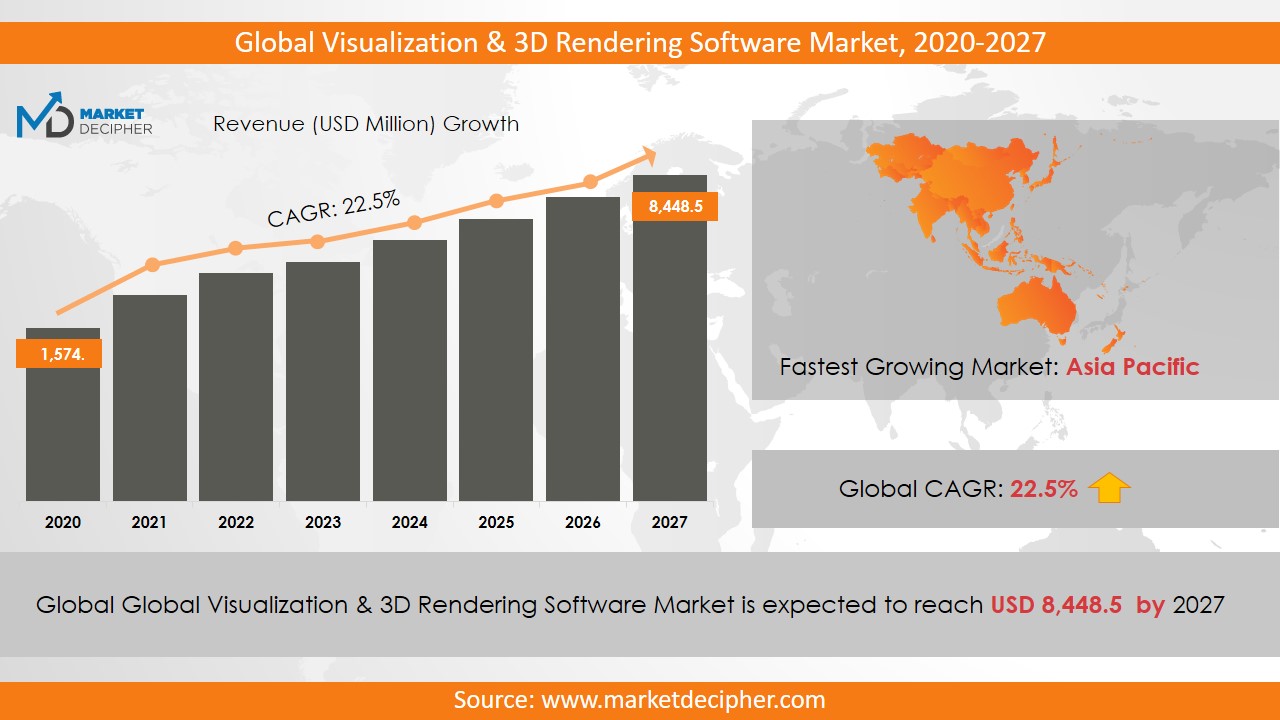
Visualization 3D Rendering Software deals with the techniques and methods for graphically representing several aspects of the software. Visualization and 3D rendering software are used for creating graphical displays and interfaces for software solutions and converts 3D models into 2D videos or images.
Visualization software comprises graphical components and objects that are used for applications and displays with the support of software editors. Global vendors invest deeply in the market to develop the overall visualization & 3D rendering solution offer to ensure low-priced and on time image analysis, virtual infrastructure modeling, and precision modeling. The upsurge in demand for best gaming interface and high growth in healthcare studies impel the Europe visualization and 3D rendering software market. Some of the factors propelling the growth of the visualization & 3D rendering software market are less time and low cost, and user-friendly renderer interface.
SEGMENT ANALYSIS
The global visualization & 3D rendering software market is classified into type, deployment model, application, end-user, and geography. The type segment comprises plugin, and stand-alone. By deployment model, the market is segmented into cloud and on-premise. The application segment includes gaming, marketing & advertisement, videography, research & training, and cartoon. Based on end-user, the market is categorized into construction & real estate, media & entertainment, education, energy & utility, healthcare & life science, and others.
MARKET PLAYER ANALYSIS
Key players operating in the global market include Siemens AG, 3D Virtualization, Luxion Inc.Act-3D B.V., Autodesk, Inc., SAP SE, Embodee Corp., Otoy Inc., Web max Technologies, and Sphere 3D. Other industries in this domain that are growing at a high CAGR include Image Sensors Market and Global Software-defined Anything (SDx) Market.
COVERAGE HIGHLIGHTS
• Market revenue estimation and forecast through (2018 – 2026)
• Revenue and sales break-down into segments and countries
• Trend analysis, market dynamics and Market player analysis
MARKET SEGMENTATION
By Type Outlook ($Revenue, 2018-2026)
• Plugin
• Stand-Alone
By Deployment Model Outlook ($Revenue, 2018-2026)
• Cloud
• On-Premise
By Application Outlook ($Revenue, 2018-2026)
• Gaming
• Marketing & Advertisement
• Videography
• Research & Training
• Cartoon
By End-user Outlook ($Revenue, 2018-2026)
• Construction & Real Estate
• Media & Entertainment
• Education
• Energy & Utility
• Healthcare & Life Science
• Others
By Regional Outlook ($Revenue, 2018-2026)
• North America
• Canada
• U.S
• Mexico
• Europe
• Germany
• France
• U.K
• Rest of Europe
• Asia-Pacific
• China
• India
• Japan
• Rest of Asia Pacific
• Latin America
• Mexico
• Brazil
• The Middle East and Africa
CHAPTER 1: INTRODUCTION
1.1. Research Methodology
1.1.1. Desk Research
1.1.2. Data Synthesis
1.1.3. Data Validation & Market Feedback
1.1.4. Data Sources
CHAPTER 2: EXECUTIVE SUMMARY
2.1. Global Market Outlook
2.2. Core Insights - Type
2.3. Core Insights – Deployment Model
2.4. Core Insights – Application
2.5. Core Insights – End-User
2.6. Core Insights – Geography
CHAPTER 3: MARKET OVERVIEW
3.1. Market Definition and Scope
3.2. Key Forces Shaping the Industry
3.2.1. Bargaining Power of Suppliers
3.2.2. Bargaining Power of Buyers
3.2.3. Threat of Substitutes
3.2.4. Threat of New Entrants
3.3. Market Dynamics
3.3.1. Drivers
3.3.1.1. Supply-side Drivers
3.3.1.2. Demand-side Drivers
3.3.2. Restraints
3.3.3. Opportunities
3.4. Industry Landscape - PESTEL Analysis
3.4.1. Political Landscape
3.4.2. Environmental Landscape
3.4.3. Social Landscape
3.4.4. Technology Landscape
3.4.5. Economic Landscape
CHAPTER 4: MARKET BACKGROUND
4.1. Industry Value Chain Analysis
4.1.1. Upstream Participants
4.1.2. Downstream participants
4.2. Pricing Analysis and Forecast, 2018-2026
4.2.1. By Type
4.2.2. By Region
CHAPTER 5: GLOBAL VISUALIZATION & 3D RENDERING MARKET, BY TYPE
5.1. Overview
5.1.1. Market Volume and Forecast, 2018-2026
5.1.2. Market Revenue (US$ Million) and Forecast, 2018-2026
5.2. Plugin
5.2.1. Key Market Trends, Growth Factors and Opportunities
5.2.2. Market Volume and Forecast, By Region
5.2.3. Market Revenue (US$ Million) and Forecast, By Region
5.3. Stand-Alone
5.3.1. Key Market Trends, Growth Factors and Opportunities
5.3.2. Market Volume and Forecast, By Region
5.3.3. Market Revenue (US$ Million) and Forecast, By Region
CHAPTER 6: GLOBAL VISUALIZATION & 3D RENDERING MARKET, BY DEPLOYMENT MODEL
6.1. Overview
6.1.1. Market Volume and Forecast, 2018-2026
6.1.2. Market Revenue (US$ Million) and Forecast, 2018-2026
6.2. Cloud
6.2.1. Key Market Trends, Growth Factors and Opportunities
6.2.2. Market Volume and Forecast, By Region
6.2.3. Market Revenue (US$ Million) and Forecast, By Region
6.3. On-Premise
6.3.1. Key Market Trends, Growth Factors and Opportunities
6.3.2. Market Volume and Forecast, By Region
6.3.3. Market Revenue (US$ Million) and Forecast, By Region
CHAPTER 7: GLOBAL VISUALIZATION & 3D RENDERING MARKET, BY APPLICATION
7.1. Overview
7.1.1. Market Volume and Forecast, 2018-2026
7.1.2. Market Revenue (US$ Million) and Forecast, 2018-2026
7.2. Gaming
7.2.1. Key Market Trends, Growth Factors and Opportunities
7.2.2. Market Volume and Forecast, By Region
7.2.3. Market Revenue (US$ Million) and Forecast, By Region
7.3. Marketing & Advertisement
7.3.1. Key Market Trends, Growth Factors and Opportunities
7.3.2. Market Volume and Forecast, By Region
7.3.3. Market Revenue (US$ Million) and Forecast, By Region
7.4. Videography
7.4.1. Key Market Trends, Growth Factors and Opportunities
7.4.2. Market Volume and Forecast, By Region
7.4.3. Market Revenue (US$ Million) and Forecast, By Region
7.5. Research & Training
7.5.1. Key Market Trends, Growth Factors and Opportunities
7.5.2. Market Volume and Forecast, By Region
7.5.3. Market Revenue (US$ Million) and Forecast, By Region
7.6. Cartoon
7.6.1. Key Market Trends, Growth Factors and Opportunities
7.6.2. Market Volume and Forecast, By Region
7.6.3. Market Revenue (US$ Million) and Forecast, By Region
CHAPTER 8: GLOBAL VISUALIZATION & 3D RENDERING MARKET, BY END-USER
8.1. Overview
8.1.1. Market Volume and Forecast, 2018-2026
8.1.2. Market Revenue (US$ Million) and Forecast, 2018-2026
8.2. Construction & Real Estate
8.2.1. Key Market Trends, Growth Factors and Opportunities
8.2.2. Market Volume and Forecast, By Region
8.2.3. Market Revenue (US$ Million) and Forecast, By Region
8.3. Media & Entertainment
8.3.1. Key Market Trends, Growth Factors and Opportunities
8.3.2. Market Volume and Forecast, By Region
8.3.3. Market Revenue (US$ Million) and Forecast, By Region
8.4. Education
8.4.1. Key Market Trends, Growth Factors and Opportunities
8.4.2. Market Volume and Forecast, By Region
8.4.3. Market Revenue (US$ Million) and Forecast, By Region
8.5. Energy & Utility
8.5.1. Key Market Trends, Growth Factors and Opportunities
8.5.2. Market Volume and Forecast, By Region
8.5.3. Market Revenue (US$ Million) and Forecast, By Region
8.6. Healthcare & Life Science
8.6.1. Key Market Trends, Growth Factors and Opportunities
8.6.2. Market Volume and Forecast, By Region
8.6.3. Market Revenue (US$ Million) and Forecast, By Region
8.7. Others
8.7.1. Key Market Trends, Growth Factors and Opportunities
8.7.2. Market Volume and Forecast, By Region
8.7.3. Market Revenue (US$ Million) and Forecast, By Region
CHAPTER 9: GLOBAL VISUALIZATION & 3D RENDERING MARKET, BY GEOGRAPHY
9.1. Overview
9.2. North America
9.2.1. Key Market Trends, Growth Factors and Opportunities
9.2.2. Market Volume and Forecast, By Type
9.2.3. Market Volume and Forecast, By Deployment Model
9.2.4. Market Volume and Forecast, By Application
9.2.5. Market Volume and Forecast, By End-User
9.2.6. Market Revenue and Forecast, By Type
9.2.7. Market Revenue and Forecast, By Deployment Model
9.2.8. Market Revenue and Forecast, By Application
9.2.9. Market Revenue and Forecast, By End-User
9.2.10. Market Revenue and Forecast, By Country
9.2.11. U.S.
9.2.11.1. Market Volume and Forecast
9.2.11.2. Market Revenue and Forecast
9.2.12. Canada
9.2.12.1. Market Volume and Forecast
9.2.12.2. Market Revenue and Forecast
9.2.13. Mexico
9.2.13.1. Market Volume and Forecast
9.2.13.2. Market Revenue and Forecast
9.3. Europe
9.3.1. Market Volume and Forecast, By Type
9.3.2. Market Volume and Forecast, By Deployment Model
9.3.3. Market Volume and Forecast, By Application
9.3.4. Market Volume and Forecast, By End-User
9.3.5. Market Revenue and Forecast, By Type
9.3.6. Market Revenue and Forecast, By Deployment Model
9.3.7. Market Revenue and Forecast, By Application
9.3.8. Market Revenue and Forecast, By End-User
9.3.9. Market Revenue and Forecast, By Country
9.3.10. Germany
9.3.10.1. Market Volume and Forecast, By Type
9.3.10.2. Market Revenue and Forecast, By Deployment Model
9.3.11. UK
9.3.11.1. Market Volume and Forecast, By Type
9.3.11.2. Market Revenue and Forecast, By Deployment Model
9.3.12. France
9.3.12.1. Market Volume and Forecast, By Type
9.3.12.2. Market Revenue and Forecast, By Deployment Model
9.3.13. Italy
9.3.13.1. Market Volume and Forecast, By Type
9.3.13.2. Market Revenue and Forecast, By Deployment Model
9.3.14. Rest of Europe
9.3.14.1. Market Volume and Forecast, By Type
9.3.14.2. Market Revenue and Forecast, By Deployment Model
9.4. Asia-Pacific
9.4.1. Market Volume and Forecast, By Type
9.4.2. Market Volume and Forecast, By Deployment Model
9.4.3. Market Volume and Forecast, By Application
9.4.4. Market Volume and Forecast, By End-User
9.4.5. Market Revenue and Forecast, By Type
9.4.6. Market Revenue and Forecast, By Deployment Model
9.4.7. Market Revenue and Forecast, By Application
9.4.8. Market Revenue and Forecast, By End-User
9.4.9. Market Revenue and Forecast, By Country
9.4.10. China
9.4.10.1. Market Volume and Forecast, By Type
9.4.10.2. Market Revenue and Forecast, By Deployment Model
9.4.11. India
9.4.11.1. Market Volume and Forecast, By Type
9.4.11.2. Market Revenue and Forecast, By Deployment Model
9.4.12. Japan
9.4.12.1. Market Volume and Forecast, By Type
9.4.12.2. Market Revenue and Forecast, By Deployment Model
9.4.13. South Korea
9.4.13.1. Market Volume and Forecast, By Type
9.4.13.2. Market Revenue and Forecast, By Deployment Model
9.4.14. Rest of Asia-Pacific
9.4.14.1. Market Volume and Forecast, By Type
9.4.14.2. Market Revenue and Forecast, By Deployment Model
9.5. REST OF THE WORLD
9.5.1. Market Volume and Forecast, By Type
9.5.2. Market Volume and Forecast, By Deployment Model
9.5.3. Market Volume and Forecast, By Application
9.5.4. Market Volume and Forecast, By End-User
9.5.5. Market Revenue and Forecast, By Type
9.5.6. Market Revenue and Forecast, By Deployment Model
9.5.7. Market Revenue and Forecast, By Application
9.5.8. Market Revenue and Forecast, By End-User
9.5.9. Market Revenue and Forecast, By Country
9.5.10. Latin America
9.5.10.1. Market Volume and Forecast, By Type
9.5.10.2. Market Revenue and Forecast, By Deployment Model
9.5.11. Middle East
9.5.11.1. Market Volume and Forecast, By Type
9.5.11.2. Market Revenue and Forecast, By Deployment Model
9.5.12. Africa
9.5.12.1. Market Volume and Forecast, By Type
9.5.12.2. Market Revenue and Forecast, By Deployment Model
CHAPTER 10: COMPETITIVE LANDSCAPE
10.1. Visualization & 3D Rendering Software Market Share Analysis, 2018
PURCHASE OPTIONS
20% Free Customization ON ALL PURCHASE
*Terms & Conditions Apply
Looking for report on this market in a particular region or country? Get In Touch
Request Free Sample
Please fill in the form below to Request for free Sample Report
-
Office Hours Mon - Sat 10:00 - 16:00
-
Call Us +91 6201075429
-
Send Us Mail sales@marketdecipher.com
Market Decipher is a market research and consultancy firm involved in provision of market reports to organisations of varied sizes; small, large and medium.

© 2018 Market Decipher. All Rights Reserved