Holographic Display Market Revenue, Sales Volume & Trend Forecast Report, 2019-2026
By Technology (Plasma, Semi transparency, Laser, Electro Holographic and Touchable), By Product (Notebooks, Kiosks, Medical Scanners, Digital Signage, and Others), By Region (North America, Europe, APAC and Rest of the World)
- Report ID : MD1027 |
- Pages : 198 |
- Tables : 96 |
- Formats :


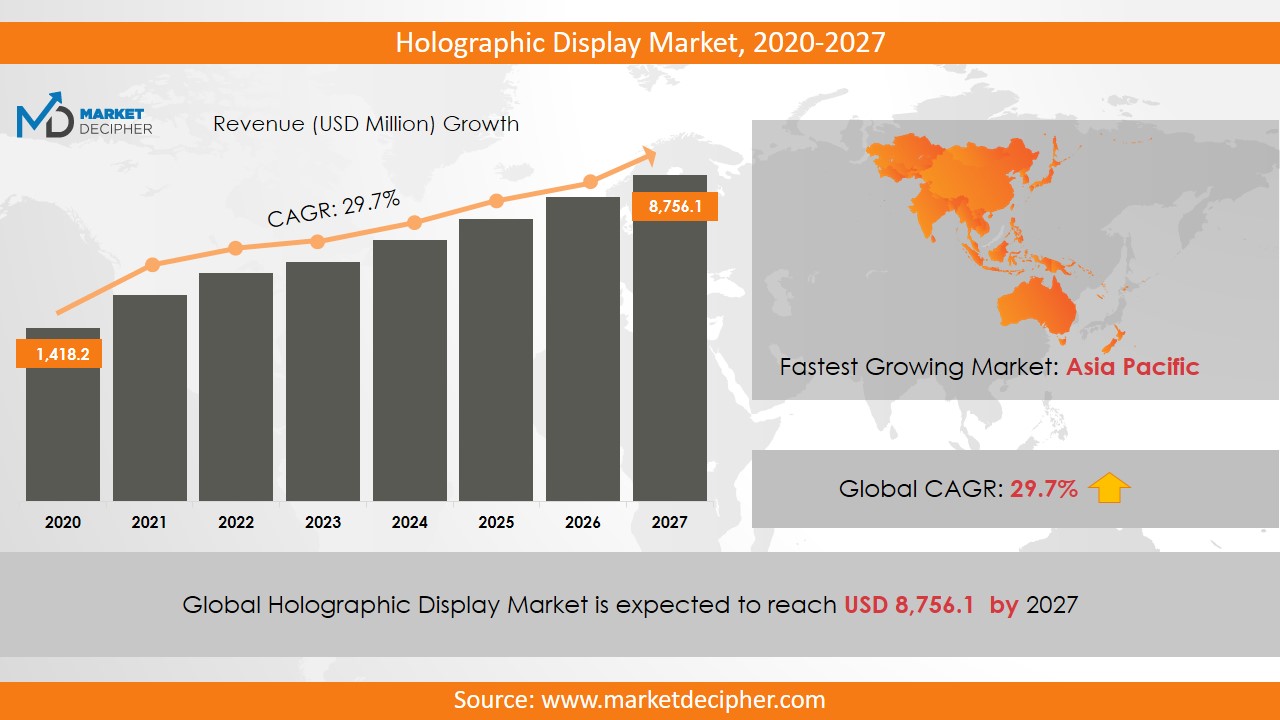
Holographic Display market revenue shall reach a value of $11.8 Billion in 2026, growing with a CAGR of 28.2% during the forecast period of 2018 to 2026. In terms of volume sales, the market is anticipated to reach XX Units.
The holographic display uses light diffraction to create a 3D image of an object. It is a type of 3D imaging technology. However, it is different from other forms of 3D imaging technology because it does not require spectacles or any other special equipment to see it. It is widely used in various fields such as conferences, fashion shows, events, and marketing. With the increasing demand for highly advanced displays, many new technologies have come into play. Due to the adoption of technologies like digital signage, this market has got a significant push in its growth. Also, these displays provide high performance and are being used widely in various sectors. These have been used extensively in medical imaging, as it has proved to be very helpful in analyzing CT scans and detecting tumors. Thus, the medical sector is creating significant revenue for this market.
The technologies used in holographic displays are laser, electro-holography, full-parallax, and MEMS. Due to the growing demand for electronic gadgets like tablets, PCs, and smartphones, holographic display market size is expected to increase significantly. However, lack of efficient projection and their high cost may pose challenges in the holographic display market growth. With the advancements in displays and imaging technologies, the market is expected to get considerable acceptance around the world.
REGIONAL ANALYSIS
The North America region dominated the Global Holographic Display market in 2018. This region generated the highest revenue of about more than 55% of the overall revenue generated in 2018 due to the various rules implemented by the government of this region. Asia Pacific region is expected to hold the largest shares of the overall market revenue over the forecast period as there is a high demand for consumer electronics in the region. Further, the U.S region is supporting market growth significantly.
SEGMENT ANALYSIS
In terms of technology, the market has been segmented as the Plasma, Semi transparency, Laser, and Electro Holographic and Touchable. The Plasma Holographic display generated significant revenue of the market in 2018 and is further anticipated to continue the same trend. This type of holographic display creates pictures in the air, independent of any type of screen. It portrays very bright and visible objects, although there is a lack of resolution and picture quality.
The touchable holographic display is unique and has interactive features. It can respond to the touch of the user through movements in the air. The device then responds quickly to the user by sending an ultrasonic air explosion in return. By product, the classification has been done as Notebooks, Kiosks, Medical Scanners, and Digital Signage and Others. The medical sector is anticipated to hold the largest market revenue in 2018. Kiosks segment generated significant revenue over the last few years as they are widely used in public places where security check is needed.
INDUSTRY PLAYER ANALYSIS
Major industry players have been analyzed with coverage on their operating areas, revenues, and other strategic aspects. These industry players include Konica Minolta Incorporated, Zebra Imaging, Provision holding Incorporated, View sonic Corporation, Musion Das Hologram Limited, Holoxica Incorporated, AV concepts Incorporated, Qualcomm Incorporated, Provision Holding Incorporated, and Eon Reality Incorporated.
COVERAGE HIGHLIGHTS
Revenue Estimation and Forecast (2018 – 2026)
Production Estimation and Forecast (2018 – 2026)
Sales/Consumption Volume Estimation and Forecast (2018 – 2026)
Breakdown of Revenue by Segments (2018 – 2026)
Breakdown of Production by Segments (2018 – 2026)
Breakdown of Sales Volume by Segments (2018 – 2026)
Gross Margin and Profitability Analysis of Companies
Business Trend and Expansion Analysis
Import and Export Analysis
Regional Analysis and Data Breakdown
SEGMENTAL ANALYSIS:
By Technology ($Revenue and Unit Sales, 2018-2026)
Plasma
Semi-transparency
Laser
Electro Holographic
Touchable
By Product ($Revenue and Unit Sales, 2018-2026)
Notebooks
Kiosks
Medical Scanners
Digital Signage
Others
By Geography ($Revenue and Unit Sales, 2018-2026)
North America
Mexico
U.S
Canada
Europe
France
U.K
Germany
Russia
Italy
Rest of Europe
Asia-Pacific
South Korea
India
Japan
China
Rest of Asia-Pacific
Rest of the World
Middle East
Africa
Latin America
CHAPTER 1. INTRODUCTION
1.1. RESEARCH METHODOLOGY
1.1.1. Data Collection
1.1.2. Data Modeling
1.1.3. Historical Revenue and Sales Estimation
1.1.4. Data Triangulation
1.2. RESEARCH PROCESS
1.2.1. Primary Research
1.2.2. Secondary Research
1.2.3. Survey Data
1.2.4. Validation by In-House Expert
1.3. HOLOGRAPHIC DISPLAY MARKET OVERVIEW
1.3.1. Research Scope and Market Definition
1.3.2. Executive Summary
CHAPTER 2. GLOBAL HOLOGRAPHIC DISPLAY MARKET DEMAND SIDE ANALYSIS
2.1. HOLOGRAPHIC DISPLAY MARKET CONSUMPTION VOLUME (BILLION UNITS), 2018 – 2025
2.2. MARKET CONSUMPTION VOLUME SPLIT BY REGION (BILLION UNITS), 2018 – 2025
2.3. MARKET CONSUMPTION VOLUME SPLIT BY COUNTRIES (BILLION UNITS), 2018 – 2025
2.4. MARKET REVENUE (BILLION USD), 2018-2025
2.5. MARKET REVENUE SPLIT BY REGION (BILLION UNITS), 2018 – 2025
2.6. HOLOGRAPHIC DISPLAY MARKET REVENUE SPLIT BY COUNTRIES (BILLION UNITS), 2018 – 2025
CHAPTER 3. GLOBAL HOLOGRAPHIC DISPLAY MARKET SUPPLY SIDE ANALYSIS
3.1. HOLOGRAPHIC DISPLAY MARKET PRODUCTION VOLUME (BILLION UNITS), 2018 – 2025
3.2. MARKET PRODUCTION VOLUME SPLIT BY REGION (BILLION UNITS), 2018-2025
3.3. MARKET PRODUCTION VOLUME SPLIT/RANKING BY COUNTRIES (BILLION UNITS), 2018 – 2025
CHAPTER 4. GLOBAL HOLOGRAPHIC DISPLAY MARKET COMPETITIVE SCENARIO & BUSINESS OPPORTUNITY ANALYSIS
4.1. COMPETITIVE STRENGTH RANKING BY MAJOR COUNTRIES, 2018
4.2. MARKET ATTRACTIVENESS RANKING BY MAJOR COUNTRIES, 2018 - 2025
4.3. EMERGING BUSINESS OPPORTUNITIES AND GROWTH PROSPECTS
4.3.1. Growth Drivers
4.3.2. Market Restraints
4.3.2. Opportunities
CHAPTER 5. GLOBAL HOLOGRAPHIC DISPLAY MARKET ENTRY STRATEGIES
5.1. ENTRY STRATEGIES IN DEVELOPING MARKETS
5.2. ENTRY STRATEGIES IN DEVELOPED MARKETS
CHAPTER 6. GLOBAL HOLOGRAPHIC DISPLAY MARKET BY TECHNOLOGY
6.1. SEGMENT OUTLINE
6.2. REVENUE SHARE BY TECHNOLOGY, $MILLION, 2018 – 2025
6.2. CONSUMPTION SHARE BY TECHNOLOGY, BILLION UNITS, 2018 - 2025
6.3. PRODUCTION SHARE BY TECHNOLOGY, BILLION UNITS, 2018 – 2025
6.4. PLASMA
6.4.1. Market determinants and trend analysis
6.4.2. Market revenue, sales and production volume, 2018 – 2025
6.5. SEMI TRANSPARENCY
6.5.1. Market determinants and trend analysis
6.5.2. Market revenue, sales and production volume, 2018 – 2025
6.6. LASER
6.6.1. Market determinants and trend analysis
6.6.2. Market revenue, sales and production volume, 2018 – 2025
6.7. ELECTRO HOLOGRAPHIC
6.7.1. Market determinants and trend analysis
6.7.2. Market revenue, sales and production volume, 2018 – 2025
6.8. TOUCHABLE
6.8.1. Market determinants and trend analysis
6.8.2. Market revenue, sales and production volume, 2018 – 2025
CHAPTER 7. GLOBAL HOLOGRAPHIC DISPLAY MARKET BY PRODUCT
7.1. SEGMENT OUTLINE
7.2. REVENUE SHARE BY PRODUCT, $MILLION, 2018 – 2025
7.2. CONSUMPTION SHARE BY PRODUCT, BILLION UNITS, 2018 - 2025
7.3. PRODUCTION SHARE BY PRODUCT, BILLION UNITS, 2018 – 2025
7.4. NOTEBOOKS
7.4.1. Market determinants and trend analysis
7.4.2. Market revenue, sales and production volume, 2018 – 2025
7.5. KIOSKS
7.5.1. Market determinants and trend analysis
7.5.2. Market revenue, sales and production volume, 2018 – 2025
7.6. MEDICAL SCANNERS
7.6.1. Market determinants and trend analysis
7.6.2. Market revenue, sales and production volume, 2018 – 2025
7.7. DIGITAL SIGNAGE
7.7.1. Market determinants and trend analysis
7.7.2. Market revenue, sales and production volume, 2018 – 2025
7.8. OTHERS
7.8.1. Market determinants and trend analysis
7.8.2. Market revenue, sales and production volume, 2018 – 2025
CHAPTER 8. GLOBAL HOLOGRAPHIC DISPLAY MARKET BY REGIONS
8.1. REGIONAL OUTLOOK
8.2. MARKET PRODUCTION, CONSUMPTION & REVENUE BY REGION, 2018-2025
8.3. NORTH AMERICA
8.3.1. Current Trends and Future Prospects
8.3.2. North America market revenue, sales and production volume, 2018 – 2025
8.3.3.U.S.
8.3.3.1. Holographic Display Market Revenue $BILLION (2018 – 2025)
8.3.3.2. Holographic Display Market Consumption BILLION Units (2018 – 2025)
8.3.3.3. Holographic Display Market Production BILLION Units (2018 – 2025)
8.3.4. Canada
8.3.4.1. Holographic Display Market Revenue $BILLION (2018 – 2025)
8.3.4.2. Holographic Display Market Consumption BILLION Units (2018 – 2025)
8.3.4.3. Holographic Display Market Production BILLION Units (2018 – 2025)
8.3.5. Mexico
8.3.5.1. Holographic Display Market Revenue $BILLION (2018 – 2025)
8.3.5.2. Holographic Display Market Consumption BILLION Units (2018 – 2025)
8.3.5.3. Holographic Display Market Production BILLION Units (2018 – 2025)
8.4. EUROPE
8.4.1. Current Trends and Future Prospects
8.4.2. Europe market revenue, sales and production volume, 2018 – 2025
8.4.3. U.K
8.4.3.1. Holographic Display Market Revenue $BILLION (2018 – 2025)
8.4.3.2. Holographic Display Market Consumption BILLION Units (2018 – 2025)
8.4.3.3. Holographic Display Market Production BILLION Units (2018 – 2025)
8.4.4. Germany
8.4.4.1. Holographic Display Market Revenue $BILLION (2018 – 2025)
8.4.4.2. Holographic Display Market Consumption BILLION Units (2018 – 2025)
8.4.4.3. Holographic Display Market Production BILLION Units (2018 – 2025)
8.4.5. France
8.4.5.1. Holographic Display Market Revenue $BILLION (2018 – 2025)
8.4.5.2. Holographic Display Market Consumption BILLION Units (2018 – 2025)
8.4.5.3. Holographic Display Market Production BILLION Units (2018 – 2025)
8.4.6. Italy
8.4.6.1. Holographic Display Market Revenue $BILLION (2018 – 2025)
8.4.6.2. Holographic Display Market Consumption BILLION Units (2018 – 2025)
8.4.6.3. Holographic Display Market Production BILLION Units (2018 – 2025)
8.4.7. Rest of Europe
8.4.7.1. Holographic Display Market Revenue $BILLION (2018 – 2025)
8.4.7.2. Holographic Display Market Consumption BILLION Units (2018 – 2025)
8.4.7.3. Holographic Display Market Production BILLION Units (2018 – 2025)
8.5. ASIA PACIFIC
8.5.1. Current Trends and Future Prospects
8.5.2. Europe market revenue, sales and production volume, 2018 – 2025
8.5.3. India
8.5.3.1. Holographic Display Market Revenue $BILLION (2018 – 2025)
8.5.3.2. Holographic Display Market Consumption BILLION Units (2018 – 2025)
8.5.3.3. Holographic Display Market Production BILLION Units (2018 – 2025)
8.5.4. Japan
8.5.4.1. Holographic Display Market Revenue $BILLION (2018 – 2025)
8.5.4.2. Holographic Display Market Consumption BILLION Units (2018 – 2025)
8.5.4.3. Holographic Display Market Production BILLION Units (2018 – 2025)
8.5.5. China
8.5.5.1. Holographic Display Market Revenue $BILLION (2018 – 2025)
8.5.5.2. Holographic Display Market Consumption BILLION Units (2018 – 2025)
8.5.5.3. Holographic Display Market Production BILLION Units (2018 – 2025)
8.5.6. South Korea
8.5.6.1. Holographic Display Market Revenue $BILLION (2018 – 2025)
8.5.6.2. Holographic Display Market Consumption BILLION Units (2018 – 2025)
8.5.6.3. Holographic Display Market Production BILLION Units (2018 – 2025)
8.5.7. Rest of APAC
8.5.7.1. Holographic Display Market Revenue $BILLION (2018 – 2025)
8.5.7.2. Holographic Display Market Consumption BILLION Units (2018 – 2025)
8.5.7.3. Holographic Display Market Production BILLION Units (2018 – 2025)
8.6. REST OF THE WORLD
8.6.1. Current Trends and Future Prospects
8.6.2. Europe market revenue, sales and production volume, 2018 – 2025
8.6.3. Latin America
8.6.3.1. Holographic Display Market Revenue $BILLION (2018 – 2025)
8.6.3.2. Holographic Display Market Consumption BILLION Units (2018 – 2025)
8.6.3.3. Holographic Display Market Production BILLION Units (2018 – 2025)
8.6.4. Middle East
8.6.4.1. Holographic Display Market Revenue $BILLION (2018 – 2025)
8.6.4.2. Holographic Display Market Consumption BILLION Units (2018 – 2025)
8.6.4.3. Holographic Display Market Production BILLION Units (2018 – 2025)
8.6.5. Africa
8.6.5.1. Holographic Display Market Revenue $BILLION (2018 – 2025)
8.6.5.2. Holographic Display Market Consumption BILLION Units (2018 – 2025)
8.6.5.3. Holographic Display Market Production BILLION Units (2018 – 2025)
CHAPTER 9. KEY VENDOR PROFILES
9.1. Konica Minolta Incorporated
9.1.1. Company overview
9.1.2. Portfolio Analysis
9.1.3. Estimated revenue from holographic display business and market share
9.1.4. Regional & business segment Revenue Analysis
9.2. Zebra Imaging
9.2.1. Company overview
9.2.2. Portfolio Analysis
9.2.3. Estimated revenue from holographic display business and market share
9.2.4. Regional & business segment Revenue Analysis
9.3. Provision holding Incorporated
9.3.1. Company overview
9.3.2. Portfolio Analysis
9.3.3. Estimated revenue from holographic display business and market share
9.3.4. Regional & business segment Revenue Analysis
9.4. View sonic Corporation
9.4.1. Company overview
9.4.2. Portfolio Analysis
9.4.3. Estimated revenue from holographic display business and market share
9.4.4. Regional & business segment Revenue Analysis
9.5. Musion Das Hologram Limited
9.5.1. Company overview
9.5.2. Portfolio Analysis
9.5.3. Estimated revenue from holographic display business and market share
9.5.4. Regional & business segment Revenue Analysis
9.6. Holoxica Incorporated
9.6.1. Company overview
9.6.2. Portfolio Analysis
9.6.3. Estimated revenue from holographic display business and market share
9.6.4. Regional & business segment Revenue Analysis
9.7. AV concepts Incorporated
9.7.1. Company overview
9.7.2. Portfolio Analysis
9.7.3. Estimated revenue from holographic display business and market share
9.7.4. Regional & business segment Revenue Analysis
9.8. Qualcomm Incorporated
9.8.1. Company overview
9.8.2. Portfolio Analysis
9.8.3. Estimated revenue from holographic display business and market share
9.8.4. Regional & business segment Revenue Analysis
9.9. Provision Holding Incorporated
9.9.1. Company overview
9.9.2. Portfolio Analysis
9.9.3. Estimated revenue from holographic display business and market share
9.9.4. Regional & business segment Revenue Analysis
9.10. Eon Reality Incorporated
9.10.1. Company overview
9.10.2. Portfolio Analysis
9.10.3. Estimated revenue from holographic display business and market share
9.10.4. Regional & business segment Revenue Analysis
PURCHASE OPTIONS
20% Free Customization ON ALL PURCHASE
*Terms & Conditions Apply
Looking for report on this market in a particular region or country? Get In Touch
Request Free Sample
Please fill in the form below to Request for free Sample Report
-
Office Hours Mon - Sat 10:00 - 16:00
-
Call Us +91 6201075429
-
Send Us Mail sales@marketdecipher.com
Market Decipher is a market research and consultancy firm involved in provision of market reports to organisations of varied sizes; small, large and medium.

© 2018 Market Decipher. All Rights Reserved