Nano Photonics Market
By Product (Photovoltaic Cells, OLED, LED, Near field optics, Optical Switches, Optical Amplifiers, and Holographic memory), By Application (Indicators and signs, Entertainment, Consumer Electronics, Telecommunication, Lighting and Non- Visual Applications), By Region (North America, Europe, APAC and Rest of the World)
- Report ID : MD1029 |
- Pages : 198 |
- Tables : 92 |
- Formats :


The study of light contact with a nanometer scale object is termed as Nanophotonics. This technology works on the principle of metal optics and Plasmonics. Some other principles on which this technology works include meta-materials and near field optics. It has many applications in science and technology such as optical microscopy, solar energy, optical communication, and bioimaging. It includes OLED, Field Optics, LED, Optical Switch, Optical Amplifier, Photovoltaic Cell, and Holographic Memory. The high demand for LEDs having high efficiency and increasing demand for light in the solid state which is ecologically favorable in nature is the main driver of the nanophotonics market shares. Due to low power consumption, OLEDs are becoming more popular and therefore the market is growing at a very high rate. However, the high costs of LED and the demand for current and heat management are factors hindering nanophotonics market growth.
Nanophotonics market revenue shall reach a value of $XX Million in 2031, growing with a CAGR of XX.X% during the forecast period of 2022 to 2031. In terms of volume sales, the market is anticipated to reach XX Units.
Many end-use industries like telecommunications, consumer electronics, and solar power are making huge investments in this technology. Also, various rules and regulations have been implemented by the government to increase the use of environment-friendly equipment. In addition, nano-particles provide large optical bandwidth and efficiency in energy which increases the nanophotonics market size. However, the low availability of raw materials and their high costs are some of the major factors that interrupt the growth of the industry.
REGIONAL ANALYSIS
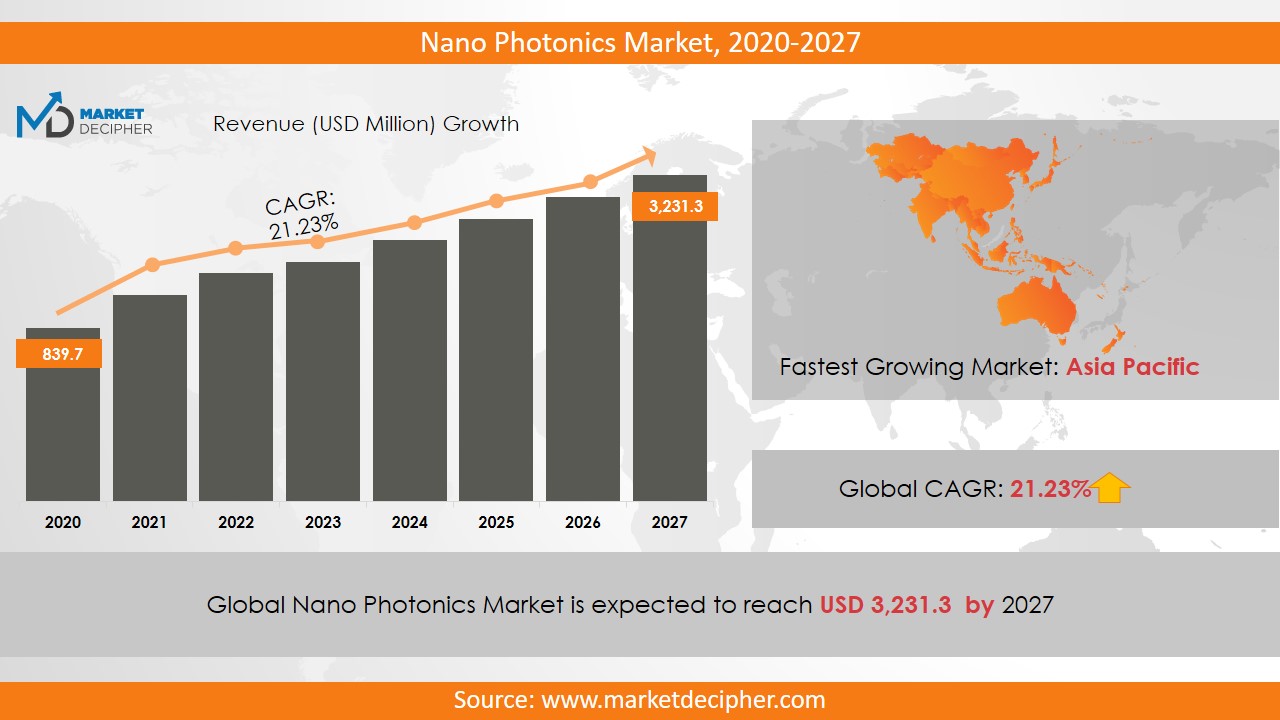
The Asia Pacific region is estimated to hold more than 70% of the market revenue and is expected to dominate over the Nanophotonics market during the forecast period. The high growth of the industry in this region is mainly attributed to the government initiatives to promote eco-friendly devices. The North America and Europe regions also contributed significantly to the market growth.
SEGMENT ANALYSIS
In terms of products, the nanophotonics market report has segmented this technology as Photovoltaic Cells, OLED, LED, Near-field optics, Optical Switches, Optical Amplifiers, and Holographic memory. The introduction of LED and OLED technology has contributed a lot to the increment in the overall revenue of the market.
Optical amplifiers dominated in contributing to the growth in the market revenue. By application, the market has been segmented as Indicators and signs, Entertainment, Consumer Electronics, Telecommunication, Lighting, and Non- Visual Applications. Plasmonics is used in many energy-based products such as solar cells and thus it is expected to increase revenue. Plasmonics deals with the optical properties of semiconductors and metals.
INDUSTRY PLAYER ANALYSIS
Major industry players have been analyzed with coverage on their operating areas, revenues, and other strategic aspects. These industry players include Nichia Corporation, Schott, Epistar Corporation, SMD LED, Philips Lumileds Lighting Company, Cree Incorporated, Nanocyl, Novarials, and Blue Nano and Cambrios Technologies. Various Industry players are adopting advanced business strategies that will influence the key nanophotonics market trends significantly during the forecast period.
COVERAGE HIGHLIGHTS
• Revenue Estimation and Forecast (2022 – 2031)
• Production Estimation and Forecast (2022 – 2031)
• Sales/Consumption Volume Estimation and Forecast (2022 – 2031)
• Breakdown of Revenue by Segments (2022 – 2031)
• Breakdown of Production by Segments (2022 – 2031)
• Breakdown of Sales Volume by Segments (2022 – 2031)
• Gross Margin and Profitability Analysis of Companies
• Business Trend and Expansion Analysis
• Import and Export Analysis
• Regional Analysis and Data Breakdown
SEGMENTAL ANALYSIS:
By Product Outlook ($Revenue and Unit Sales, 2022-2031)
• Photovoltaic Cells
• OLED
• LED
• Near field optics
• Optical Switches
• Optical Amplifiers
• Holographic memory
By Application Outlook ($Revenue and Unit Sales, 2022-2031)
• Indicators and signs
• Entertainment
• Consumer Electronics
• Telecommunication
• Lighting
• Non- Visual Applications
By Geographical Outlook ($Revenue and Unit Sales, 2022-2031)
• North America
• Canada
• U.S
• Europe
• U.K
• Germany
• Asia-Pacific
• Japan
• China
• India
• Rest of the World
• Latin America
• The Middle East and Africa
Need Report on a particular Country OR need a Tailored/Customized Research? Budget Limits/Price Discounts Query...!
Email to David Correa
OR Fill the below "Sample Request FORM" with your queries in the message box.
CHAPTER 1. INTRODUCTION
1.1. RESEARCH METHODOLOGY
1.1.1. Data Collection
1.1.2. Data Modeling
1.1.3. Historical Revenue and Sales Estimation
1.1.4. Data Triangulation
1.2. RESEARCH PROCESS
1.2.1. Primary Research
1.2.2. Secondary Research
1.2.3. Survey Data
1.2.4. Validation by In-House Expert
1.3.NANOPHOTONICS MARKET OVERVIEW
1.3.1. Research Scope and Market Definition
1.3.2. Executive Summary
CHAPTER 2.GLOBAL NANOPHOTONICS MARKET DEMAND SIDE ANALYSIS
2.1.NANOPHOTONICS MARKET CONSUMPTION VOLUME (MILLION UNITS), 2018 – 2025
2.2. MARKET CONSUMPTION VOLUME SPLIT BY REGION (MILLION UNITS), 2018 – 2025
2.3. MARKET CONSUMPTION VOLUME SPLIT BY COUNTRIES (MILLION UNITS), 2018 – 2025
2.4. MARKET REVENUE (MILLION USD), 2018-2025
2.5. MARKET REVENUE SPLIT BY REGION (MILLION UNITS), 2018 – 2025
2.6.NANOPHOTONICS MARKET REVENUE SPLIT BY COUNTRIES (MILLION UNITS), 2018 – 2025
CHAPTER 3. GLOBAL NANOPHOTONICS MARKET SUPPLY SIDE ANALYSIS
3.1.NANOPHOTONICS MARKET PRODUCTION VOLUME (MILLION UNITS), 2018 – 2025
3.2. MARKET PRODUCTION VOLUME SPLIT BY REGION (MILLION UNITS), 2018-2025
3.3. MARKET PRODUCTION VOLUME SPLIT/RANKING BY COUNTRIES (MILLION UNITS), 2018 – 2025
CHAPTER 4. GLOBAL NANOPHOTONICS MARKET COMPETITIVE SCENARIO & BUSINESS OPPORTUNITY ANALYSIS
4.1. COMPETITIVE STRENGTH RANKING BY MAJOR COUNTRIES, 2018
4.2. MARKET ATTRACTIVENESS RANKING BY MAJOR COUNTRIES, 2018 - 2025
4.3. EMERGING BUSINESS OPPORTUNITIES AND GROWTH PROSPECTS
4.3.1. Growth Drivers
4.3.2. Market Restraints
4.3.2. Opportunities
CHAPTER 5. GLOBAL NANOPHOTONICS MARKET ENTRY STRATEGIES
5.1. ENTRY STRATEGIES IN DEVELOPING MARKETS
5.2. ENTRY STRATEGIES IN DEVELOPED MARKETS
CHAPTER 6. GLOBAL NANOPHOTONICS MARKET BY PRODUCT
6.1. SEGMENT OUTLINE
6.2. REVENUE SHARE BY PRODUCT, $MILLION, 2018 – 2025
6.2. CONSUMPTION SHARE BY PRODUCT, MILLION UNITS, 2018 - 2025
6.3. PRODUCTION SHARE BY PRODUCT, MILLION UNITS, 2018 – 2025
6.4. PHOTOVOLTAIC CELLS
6.4.1. Market determinants and trend analysis
6.4.2. Market revenue, sales and production volume, 2018 – 2025
6.5. OLED
6.5.1. Market determinants and trend analysis
6.5.2. Market revenue, sales and production volume, 2018 – 2025
6.6. LED
6.6.1. Market determinants and trend analysis
6.6.2. Market revenue, sales and production volume, 2018 – 2025
6.7. NEAR FIELD OPTICS
6.7.1. Market determinants and trend analysis
6.7.2. Market revenue, sales and production volume, 2018 – 2025
6.8. OPTICAL SWITCHES
6.8.1. Market determinants and trend analysis
6.8.2. Market revenue, sales and production volume, 2018 – 2025
6.9. OPTICAL AMPLIFIERS
6.9.1. Market determinants and trend analysis
6.9.2. Market revenue, sales and production volume, 2018 – 2025
6.10. HOLOGRAPHIC MEMORY
6.9.1. Market determinants and trend analysis
6.9.2. Market revenue, sales and production volume, 2018 – 2025
CHAPTER 7.GLOBAL NANOPHOTONICS MARKET BY APPLICATION
7.1. SEGMENT OUTLINE
7.2. REVENUE SHARE BY APPLICATION, $MILLION, 2018 – 2025
7.2. CONSUMPTION SHARE BY APPLICATION, MILLION UNITS, 2018 - 2025
7.3. PRODUCTION SHARE BY APPLICATION, MILLION UNITS, 2018 – 2025
7.4. INDICATORS AND SIGNS
7.4.1. Market determinants and trend analysis
7.4.2. Market revenue, sales and production volume, 2018 – 2025
7.5. ENTERTAINMENT
7.5.1. Market determinants and trend analysis
7.5.2. Market revenue, sales and production volume, 2018 – 2025
7.6. CONSUMER ELECTRONICS
7.6.1. Market determinants and trend analysis
7.6.2. Market revenue, sales and production volume, 2018 – 2025
7.7. TELECOMMUNICATION
7.7.1. Market determinants and trend analysis
7.7.2. Market revenue, sales and production volume, 2018 – 2025
7.8. LIGHTING
7.8.1. Market determinants and trend analysis
7.8.2. Market revenue, sales and production volume, 2018 – 2025
7.9. NON- VISUAL APPLICATIONS
7.9.1. Market determinants and trend analysis
7.9.2. Market revenue, sales and production volume, 2018 – 2025
CHAPTER 8.GLOBAL NATO PHOTONICS MARKET BY REGIONS
8.1. REGIONAL OUTLOOK
8.2. MARKET PRODUCTION, CONSUMPTION & REVENUE BY REGION, 2018-2025
8.3. NORTH AMERICA
8.3.1. Current Trends and Future Prospects
8.3.2. North America market revenue, sales and production volume, 2018 – 2025
8.3.3.U.S.
8.3.3.1.Nano-Photonics Market Revenue $Million (2018 – 2025)
8.3.3.2.Nano-Photonics Market Consumption Million Units (2018 – 2025)
8.3.3.3.Nano-Photonics Market Production Million Units (2018 – 2025)
8.3.4. Canada
8.3.4.1.Nano-Photonics Market Revenue $Million (2018 – 2025)
8.3.4.2.Nano-Photonics Market Consumption Million Units (2018 – 2025)
8.3.4.3.Nano-Photonics Market Production Million Units (2018 – 2025)
8.3.5. Mexico
8.3.5.1.Nano-Photonics Market Revenue $Million (2018 – 2025)
8.3.5.2.Nano-Photonics Market Consumption Million Units (2018 – 2025)
8.3.5.3.Nano-Photonics Market Production Million Units (2018 – 2025)
8.4. EUROPE
8.4.1. Current Trends and Future Prospects
8.4.2. Europe market revenue, sales and production volume, 2018 – 2025
8.4.3. U.K
8.4.3.1.Nano-Photonics Market Revenue $Million (2018 – 2025)
8.4.3.2.Nano-Photonics Market Consumption Million Units (2018 – 2025)
8.4.3.3.Nano-Photonics Market Production Million Units (2018 – 2025)
8.4.4. Germany
8.4.4.1.Nano-Photonics Market Revenue $Million (2018 – 2025)
8.4.4.2.Nano-Photonics Market Consumption Million Units (2018 – 2025)
8.4.4.3.Nano-Photonics Market Production Million Units (2018 – 2025)
8.4.5. France
8.4.5.1.Nano-Photonics Market Revenue $Million (2018 – 2025)
8.4.5.2.Nano-Photonics Market Consumption Million Units (2018 – 2025)
8.4.5.3.Nano-Photonics Market Production Million Units (2018 – 2025)
8.4.6. Italy
8.4.6.1.Nano-Photonics Market Revenue $Million (2018 – 2025)
8.4.6.2.Nano-Photonics Market Consumption Million Units (2018 – 2025)
8.4.6.3.Nano-Photonics Market Production Million Units (2018 – 2025)
8.4.7. Rest of Europe
8.4.7.1.Nano-Photonics Market Revenue $Million (2018 – 2025)
8.4.7.2.Nano-Photonics Market Consumption Million Units (2018 – 2025)
8.4.7.3.Nano-Photonics Market Production Million Units (2018 – 2025)
8.5. ASIA PACIFIC
8.5.1. Current Trends and Future Prospects
8.5.2. Europe market revenue, sales and production volume, 2018 – 2025
8.5.3. India
8.5.3.1.Nano-Photonics Market Revenue $Million (2018 – 2025)
8.5.3.2.Nano-Photonics Market Consumption Million Units (2018 – 2025)
8.5.3.3.Nano-Photonics Market Production Million Units (2018 – 2025)
8.5.4. Japan
8.5.4.1.Nano-Photonics Market Revenue $Million (2018 – 2025)
8.5.4.2.Nano-Photonics Market Consumption Million Units (2018 – 2025)
8.5.4.3.Nano-Photonics Market Production Million Units (2018 – 2025)
8.5.5. China
8.5.5.1.Nano-Photonics Market Revenue $Million (2018 – 2025)
8.5.5.2.Nano-Photonics Market Consumption Million Units (2018 – 2025)
8.5.5.3.Nano-Photonics Market Production Million Units (2018 – 2025)
8.5.6. South Korea
8.5.6.1.Nano-Photonics Market Revenue $Million (2018 – 2025)
8.5.6.2.Nano-Photonics Market Consumption Million Units (2018 – 2025)
8.5.6.3.Nano-Photonics Market Production Million Units (2018 – 2025)
8.5.7. Rest of APAC
8.5.7.1.Nano-Photonics Market Revenue $Million (2018 – 2025)
8.5.7.2.Nano-Photonics Market Consumption Million Units (2018 – 2025)
8.5.7.3.Nano-Photonics Market Production Million Units (2018 – 2025)
8.6. REST OF THE WORLD
8.6.1. Current Trends and Future Prospects
8.6.2. Europe market revenue, sales and production volume, 2018 – 2025
8.6.3. Latin America
8.6.3.1.Nano-Photonics Market Revenue $Million (2018 – 2025)
8.6.3.2.Nano-Photonics Market Consumption Million Units (2018 – 2025)
8.6.3.3.Nano-Photonics Market Production Million Units (2018 – 2025)
8.6.4. Middle East
8.6.4.1.Nano-Photonics Market Revenue $Million (2018 – 2025)
8.6.4.2.Nano-Photonics Market Consumption Million Units (2018 – 2025)
8.6.4.3.Nano-Photonics Market Production Million Units (2018 – 2025)
8.6.5. Africa
8.6.5.1.Nano-Photonics Market Revenue $Million (2018 – 2025)
8.6.5.2.Nano-Photonics Market Consumption Million Units (2018 – 2025)
8.6.5.3.Nano-Photonics Market Production Million Units (2018 – 2025)
CHAPTER 9. KEY VENDOR PROFILES
9.1. Nichia Corporation
9.1.1. Company overview
9.1.2. Portfolio Analysis
9.1.3. Estimated revenue from nanophotonics business and market share
9.1.4. Regional & business segment Revenue Analysis
9.2. Schott
9.2.1. Company overview
9.2.2. Portfolio Analysis
9.2.3. Estimated revenue from nanophotonics business and market share
9.2.4. Regional & business segment Revenue Analysis
9.3. Epistar Corporation
9.3.1. Company overview
9.3.2. Portfolio Analysis
9.3.3. Estimated revenue from nanophotonics business and market share
9.3.4. Regional & business segment Revenue Analysis
9.4. SMD LED
9.4.1. Company overview
9.4.2. Portfolio Analysis
9.4.3. Estimated revenue from nanophotonics business and market share
9.4.4. Regional & business segment Revenue Analysis
9.5. Philips Lumileds Lighting Company
9.5.1. Company overview
9.5.2. Portfolio Analysis
9.5.3. Estimated revenue from nanophotonics business and market share
9.5.4. Regional & business segment Revenue Analysis
9.6. Cree Incorporated
9.6.1. Company overview
9.6.2. Portfolio Analysis
9.6.3. Estimated revenue from nanophotonics business and market share
9.6.4. Regional & business segment Revenue Analysis
9.7. Nanocyl
9.7.1. Company overview
9.7.2. Portfolio Analysis
9.7.3. Estimated revenue from nanophotonics business and market share
9.7.4. Regional & business segment Revenue Analysis
9.8. Novarials
9.8.1. Company overview
9.8.2. Portfolio Analysis
9.8.3. Estimated revenue from nanophotonics business and market share
9.8.4. Regional & business segment Revenue Analysis
9.9. Blueman and Cambrios Technologies
9.9.1. Company overview
9.9.2. Portfolio Analysis
9.9.3. Estimated revenue from nanophotonics business and market share
9.9.4. Regional & business segment Revenue Analysis
PURCHASE OPTIONS
20% Free Customization ON ALL PURCHASE
*Terms & Conditions Apply
Looking for report on this market in a particular region or country? Get In Touch
Request Free Sample
Please fill in the form below to Request for free Sample Report
-
Office Hours Mon - Sat 10:00 - 16:00
-
Call Us +91 6201075429
-
Send Us Mail sales@marketdecipher.com
Market Decipher is a market research and consultancy firm involved in provision of market reports to organisations of varied sizes; small, large and medium.

© 2018 Market Decipher. All Rights Reserved