Network Security Sandbox Market Revenue and Trend Forecasts Report, 2019-2026
By Services (Network Security Maintenance, Product subscription, and Professional Consulting), By Solution, By Application (BFSI, Defense, IT and Telecommunication, Education, Retail, Public sector, and others), By Region (North America, Europe, APAC and Rest of the World)
- Report ID : MD1074 |
- Pages : 198 |
- Tables : 72 |
- Formats :


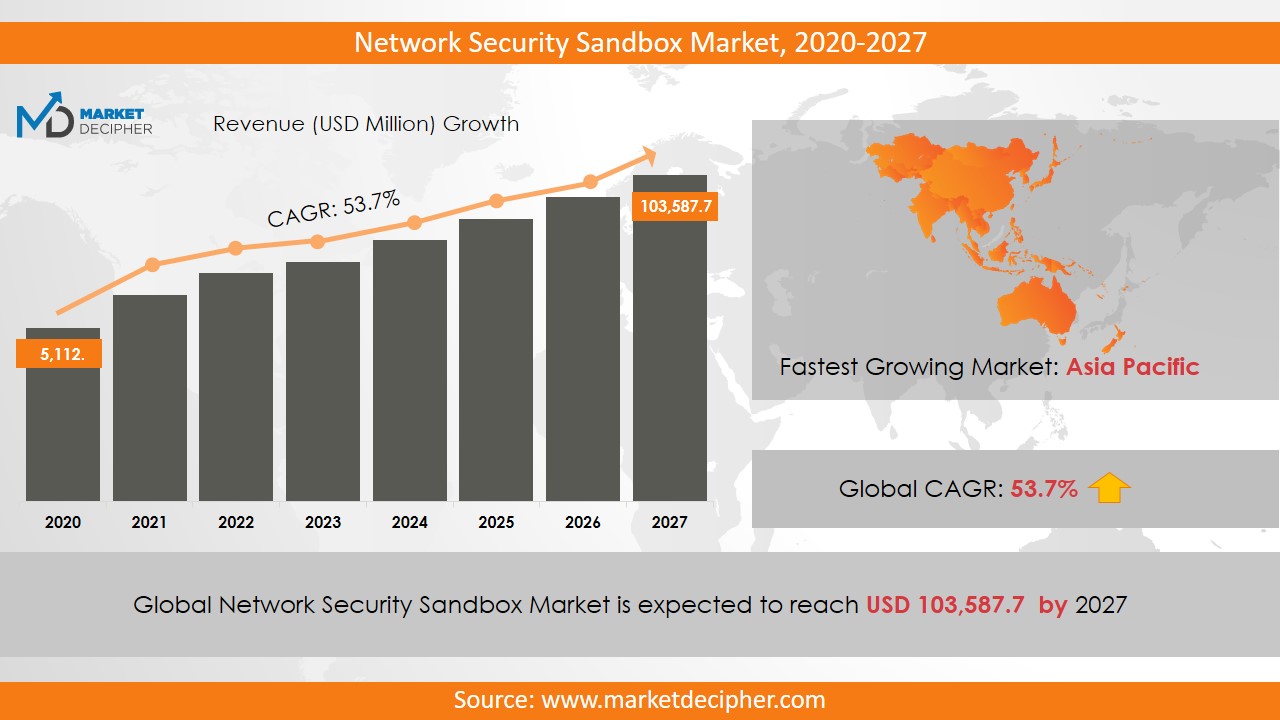
Network Security Sandbox market revenue shall reach a value of $1,140 Million in 2025, growing with a CAGR of 30.25% during the forecast period of 2018 to 2025. In terms of volume sales, the market is anticipated to reach XX Units.
The growing cyber attacks and threats to the data had led this new technology to come into play. A sandbox is a security tool in which a different environment is created. Sandbox is used in the case of unauthorized charges from third parties. A cybersecurity sandbox mainly analyses an environment in which testing of a program is perceived, performed, noted and evaluation is done automatically. It is an effective security technique as it prevents the program from malfunctioning by isolating it. This is one of the major factors driving the growth of the market. The development of the enhanced antivirus and anti-malware software further supports the market at a significant rate. However, some technical drawbacks and the high cost of the installation of these devices are the major hindrances for market growth. Further, these devices consume power at a high rate which is further blocking the growth of the market. Cybersecurity sandbox is widely being used in the sectors such as defense, retail, education, BFSI, Public sector, and others and thereby these sectors are contributing significantly in propelling the market revenue during the forecast period. Increasing sophistication in the networks owing to the increasing adoption of several new technologies such as the Internet of Things, smartphones, cloud services and Bring Your Own Device in the business sector is supporting the market growth. Further, the lack of awareness about advanced network attacks may hinder the market growth during the forecast period.
REGIONAL ANALYSIS
Owing to the presence of wide industries and high adoption of advanced technologies, the North America region is expected to grow significantly over the forecast period. This region generated about 47.6% of the total market revenue. Further, the Asia Pacific region is anticipated to grow at a fast rate over the forecast period owing to the developing countries such as India and China in the region. The high adoption of network security sandbox in the BFSI sector is responsible for the market growth in this region.
SEGMENT ANALYSIS
In terms of Service, the market has been segmented as Network Security Maintenance, Product subscription, and Professional Consulting. The product subscription segment is anticipated to dominate in propelling the market growth over the forecast period. On the basis of solutions, the market has been segmented as integrated and standalone. Out of which the integrated solution generated significant revenue in recent years. The high growth of integrated solution is mainly due to the development of virtual servers and high adoption of cloud computing among organizations. Cloud computing is becoming more popular owing to its affordable cost and easy operation. Whereas, the integrated solutions cost a bit high. Further, the standalone segmented dominated the market in terms of revenue owing to its affordable cost. However, the excessive deployment of cloud can have adverse effects on the security of industries. By application, the market has been segmented as BFSI, Defense, IT and Telecommunication, Education, Retail, Public sector, and others. The retail sector has been accounted to be the highest sector contributing to the market growth in 2018. The credit for the growth of this segment is given to the retailer’s efficiency to provide easy access to the digital connection owing to the high adoption of advanced technologies.
MARKET PLAYER ANALYSIS
Major market players have been analyzed with coverage on their operating areas, revenues, and other strategic aspects. These market players include Lastline Incorporated, Cisco, Check Point Software Technologies Limited, McAfee, Symantec Corporation, FireEye Incorporated, Fortinet Incorporated, Sonic Wall and Palo Alto Networks Incorporated.
COVERAGE HIGHLIGHTS
• Market Revenue Estimation and Forecast (2018 – 2025)
• Market Production Estimation and Forecast (2018 – 2025)
• Market Sales/Consumption Volume Estimation and Forecast (2018 – 2025)
• Breakdown of Revenue by Segments (2018 – 2025)
• Breakdown of Production by Segments (2018 – 2025)
• Breakdown of Sales Volume by Segments (2018 – 2025)
• Gross Margin and Profitability Analysis of Companies
• Business Trend and Expansion Analysis
• Import and Export Analysis
• Regional Analysis and Market Data Breakdown
MARKET SEGMENTATION
By Service Outlook ($Revenue, 2018-2025)
• Network Security Maintenance
• Product subscription
• Professional Consulting
By Solution Outlook ($Revenue, 2018-2025)
• Services
• Standalone
By Application Outlook ($Revenue, 2018-2025)
• BFSI
• Defense
• IT and Telecommunication
• Education
• Retail
• Public sector
• Others
By Regional Outlook ($Revenue and Unit Sales, 2018-2025)
• North America
• Canada
• U.S
• Mexico
• Europe
• Germany
• U.K
• France
• Netherlands
• Austria
• Rest of Europe
• Asia-Pacific
• China
• India
• Japan
• South Korea
• Australia
• Rest of Asia Pacific
• The Middle East and Africa
• Saudi Arabia
• United Arab Emirates
• Rest of Middle East
• Africa
• South America
• Brazil
• Argentina
• Rest of South America
Market Players
• Lastline Incorporated
• Cisco
• Check Point Software Technologies Limited
• McAfee
• Symantec Corporation
• FireEye Incorporated
• Fortinet Incorporated
• Sonic Wall
• Palo Alto Networks Incorporated
CHAPTER 1. INTRODUCTION
1.1. RESEARCH METHODOLOGY
1.1.1. Data Collection
1.1.2. Data Modeling
1.1.3. Historical Revenue and Sales Estimation
1.1.4. Data Triangulation
1.2. RESEARCH PROCESS
1.2.1. Primary Research
1.2.2. Secondary Research
1.2.3. Survey Data
1.2.4. Validation by In-House Expert
1.3. NETWORK SECURITY SANDBOX MARKET OVERVIEW
1.3.1. Research Scope and Market Definition
1.3.2. Executive Summary
CHAPTER 2. GLOBAL NETWORK SECURITY SANDBOX MARKET DEMAND SIDE ANALYSIS
2.1. NETWORK SECURITY SANDBOX MARKET CONSUMPTION VOLUME (MILLION UNITS), 2018 – 2025
2.2. MARKET CONSUMPTION VOLUME SPLIT BY REGION (MILLION UNITS), 2018 – 2025
2.3. MARKET CONSUMPTION VOLUME SPLIT BY COUNTRIES (MILLION UNITS), 2018 – 2025
2.4. MARKET REVENUE (MILLION USD), 2018-2025
2.5. MARKET REVENUE SPLIT BY REGION (MILLION UNITS), 2018 – 2025
2.6. NETWORK SECURITY SANDBOX MARKET REVENUE SPLIT BY COUNTRIES (MILLION UNITS), 2018 – 2025
CHAPTER 3. GLOBAL NETWORK SECURITY SANDBOX MARKET SUPPLY SIDE ANALYSIS
3.1. NETWORK SECURITY SANDBOX MARKET PRODUCTION VOLUME (MILLION UNITS), 2018 – 2025
3.2. MARKET PRODUCTION VOLUME SPLIT BY REGION (MILLION UNITS), 2018-2025
3.3. MARKET PRODUCTION VOLUME SPLIT/RANKING BY COUNTRIES (MILLION UNITS), 2018 – 2025
CHAPTER 4. GLOBAL NETWORK SECURITY SANDBOX MARKET COMPETITIVE SCENARIO & BUSINESS OPPORTUNITY ANALYSIS
4.1. COMPETITIVE STRENGTH RANKING BY MAJOR COUNTRIES, 2018
4.2. MARKET ATTRACTIVENESS RANKING BY MAJOR COUNTRIES, 2018 - 2025
4.3. EMERGING BUSINESS OPPORTUNITIES AND GROWTH PROSPECTS
4.3.1. Growth Drivers
4.3.2. Market Restraints
4.3.2. Opportunities
CHAPTER 5. GLOBAL NETWORK SECURITY SANDBOX MARKET ENTRY STRATEGIES
5.1. ENTRY STRATEGIES IN DEVELOPING MARKETS
5.2. ENTRY STRATEGIES IN DEVELOPED MARKETS
CHAPTER 6. GLOBAL NETWORK SECURITY SANDBOX MARKET BY SERVICE
6.1. SEGMENT OUTLINE
6.2. REVENUE SHARE BY SERVICE, $MILLION, 2018 – 2025
6.2. CONSUMPTION SHARE BY SERVICE, MILLION UNITS, 2018 - 2025
6.3. PRODUCTION SHARE BY SERVICE, MILLION UNITS, 2018 – 2025
6.4. NETWORK SECURITY MAINTENANCE
6.4.1. Market determinants and trend analysis
6.4.2. Market revenue, sales and production volume, 2018 – 2025
6.5. PRODUCT SUBSCRIPTION
6.5.1. Market determinants and trend analysis
6.5.2. Market revenue, sales and production volume, 2018 – 2025
6.6. PROFESSIONAL CONSULTING
6.6.1. Market determinants and trend analysis
6.6.2. Market revenue, sales and production volume, 2018 – 2025
CHAPTER 7. GLOBAL NETWORK SECURITY SANDBOX MARKET BY SOLUTION
7.1. SEGMENT OUTLINE
7.2. REVENUE SHARE BY SOLUTION, $MILLION, 2018 – 2025
7.2. CONSUMPTION SHARE BY SOLUTION, MILLION UNITS, 2018 - 2025
7.3. PRODUCTION SHARE BY SOLUTION, MILLION UNITS, 2018 – 2025
7.4. SERVICES
7.4.1. Market determinants and trend analysis
7.4.2. Market revenue, sales and production volume, 2018 – 2025
7.5. STANDALONE
7.5.1. Market determinants and trend analysis
7.5.2. Market revenue, sales and production volume, 2018 – 2025
CHAPTER 8. GLOBAL NETWORK SECURITY SANDBOX MARKET BY APPLICATION
8.1. SEGMENT OUTLINE
8.2. REVENUE SHARE BY APPLICATION, $MILLION, 2018 – 2025
8.2. CONSUMPTION SHARE BY APPLICATION, MILLION UNITS, 2018 - 2025
8.3. PRODUCTION SHARE BY APPLICATION, MILLION UNITS, 2018 – 2025
8.4. BFSI
8.4.1. Market determinants and trend analysis
8.4.2. Market revenue, sales and production volume, 2018 – 2025
8.5. DEFENSE
8.5.1. Market determinants and trend analysis
8.5.2. Market revenue, sales and production volume, 2018 – 2025
8.6. IT AND TELECOMMUNICATION
8.6.1. Market determinants and trend analysis
8.6.2. Market revenue, sales and production volume, 2018 – 2025
8.7. EDUCATION
8.7.1. Market determinants and trend analysis
8.7.2. Market revenue, sales and production volume, 2018 – 2025
8.8. RETAIL
8.8.1. Market determinants and trend analysis
8.8.2. Market revenue, sales and production volume, 2018 – 2025
8.9. PUBLIC SECTOR
8.9.1. Market determinants and trend analysis
8.9.2. Market revenue, sales and production volume, 2018 – 2025
8.10. OTHERS
8.10.1. Market determinants and trend analysis
8.10.2. Market revenue, sales and production volume, 2018 – 2025
CHAPTER 9. GLOBAL NETWORK SECURITY SANDBOX MARKET BY REGIONS
9.1. REGIONAL OUTLOOK
9.2. MARKET PRODUCTION, CONSUMPTION & REVENUE BY REGION, 2018-2025
9.3. NORTH AMERICA
9.3.1. Current Trends and Future Prospects
9.3.2. North America market revenue, sales and production volume, 2018 – 2025
9.3.3.U.S.
9.3.3.1. Network Security Sandbox Market Revenue $Million (2018 – 2025)
9.3.3.2. Network Security Sandbox Market Consumption Million Units (2018 – 2025)
9.3.3.3. Network Security Sandbox Market Production Million Units (2018 – 2025)
9.3.4. Canada
9.3.4.1. Network Security Sandbox Market Revenue $Million (2018 – 2025)
9.3.4.2. Network Security Sandbox Market Consumption Million Units (2018 – 2025)
9.3.4.3. Network Security Sandbox Market Production Million Units (2018 – 2025)
9.3.5. Mexico
9.3.5.1. Network Security Sandbox Market Revenue $Million (2018 – 2025)
9.3.5.2. Network Security Sandbox Market Consumption Million Units (2018 – 2025)
9.3.5.3. Network Security Sandbox Market Production Million Units (2018 – 2025)
9.4. EUROPE
9.4.1. Current Trends and Future Prospects
9.4.2. Europe market revenue, sales and production volume, 2018 – 2025
9.4.3. U.K
9.4.3.1. Network Security Sandbox Market Revenue $Million (2018 – 2025)
9.4.3.2. Network Security Sandbox Market Consumption Million Units (2018 – 2025)
9.4.3.3. Network Security Sandbox Market Production Million Units (2018 – 2025)
9.4.4. Germany
9.4.4.1. Network Security Sandbox Market Revenue $Million (2018 – 2025)
9.4.4.2. Network Security Sandbox Market Consumption Million Units (2018 – 2025)
9.4.4.3. Network Security Sandbox Market Production Million Units (2018 – 2025)
9.4.5. France
9.4.5.1. Network Security Sandbox Market Revenue $Million (2018 – 2025)
9.4.5.2. Network Security Sandbox Market Consumption Million Units (2018 – 2025)
9.4.5.3. Network Security Sandbox Market Production Million Units (2018 – 2025)
9.4.6. Italy
9.4.6.1. Network Security Sandbox Market Revenue $Million (2018 – 2025)
9.4.6.2. Network Security Sandbox Market Consumption Million Units (2018 – 2025)
9.4.6.3. Network Security Sandbox Market Production Million Units (2018 – 2025)
9.4.7. Rest of Europe
9.4.7.1. Network Security Sandbox Market Revenue $Million (2018 – 2025)
9.4.7.2. Network Security Sandbox Market Consumption Million Units (2018 – 2025)
9.4.7.3. Network Security Sandbox Market Production Million Units (2018 – 2025)
9.5. ASIA PACIFIC
9.5.1. Current Trends and Future Prospects
9.5.2. Europe market revenue, sales and production volume, 2018 – 2025
9.5.3. India
9.5.3.1. Network Security Sandbox Market Revenue $Million (2018 – 2025)
9.5.3.2. Network Security Sandbox Market Consumption Million Units (2018 – 2025)
9.5.3.3. Network Security Sandbox Market Production Million Units (2018 – 2025)
9.5.4. Japan
9.5.4.1. Network Security Sandbox Market Revenue $Million (2018 – 2025)
9.5.4.2. Network Security Sandbox Market Consumption Million Units (2018 – 2025)
9.5.4.3. Network Security Sandbox Market Production Million Units (2018 – 2025)
9.5.5. China
9.5.5.1. Network Security Sandbox Market Revenue $Million (2018 – 2025)
9.5.5.2. Network Security Sandbox Market Consumption Million Units (2018 – 2025)
9.5.5.3. Network Security Sandbox Market Production Million Units (2018 – 2025)
9.5.6. South Korea
9.5.6.1. Network Security Sandbox Market Revenue $Million (2018 – 2025)
9.5.6.2. Network Security Sandbox Market Consumption Million Units (2018 – 2025)
9.5.6.3. Network Security Sandbox Market Production Million Units (2018 – 2025)
9.5.7. Rest of APAC
9.5.7.1. Network Security Sandbox Market Revenue $Million (2018 – 2025)
9.5.7.2. Network Security Sandbox Market Consumption Million Units (2018 – 2025)
9.5.7.3. Network Security Sandbox Market Production Million Units (2018 – 2025)
9.6. REST OF THE WORLD
9.6.1. Current Trends and Future Prospects
9.6.2. Europe market revenue, sales and production volume, 2018 – 2025
9.6.3. Latin America
9.6.3.1. Network Security Sandbox Market Revenue $Million (2018 – 2025)
9.6.3.2. Network Security Sandbox Market Consumption Million Units (2018 – 2025)
9.6.3.3. Network Security Sandbox Market Production Million Units (2018 – 2025)
9.6.4. Middle East
9.6.4.1. Network Security Sandbox Market Revenue $Million (2018 – 2025)
9.6.4.2. Network Security Sandbox Market Consumption Million Units (2018 – 2025)
9.6.4.3. Network Security Sandbox Market Production Million Units (2018 – 2025)
9.6.5. Africa
9.6.5.1. Network Security Sandbox Market Revenue $Million (2018 – 2025)
9.6.5.2. Network Security Sandbox Market Consumption Million Units (2018 – 2025)
9.6.5.3. Network Security Sandbox Market Production Million Units (2018 – 2025)
CHAPTER 10. KEY VENDOR PROFILES
10.1. Lastline Incorporated
10.1.1. Company overview
10.1.2. Portfolio Analysis
10.1.3. Estimated revenue from network security sandbox business and market share
10.1.4. Regional & business segment Revenue Analysis
10.2. Cisco
10.2.1. Company overview
10.2.2. Portfolio Analysis
10.2.3. Estimated revenue from network security sandbox business and market share
10.2.4. Regional & business segment Revenue Analysis
10.3. Check Point Software Technologies Limited
10.3.1. Company overview
10.3.2. Portfolio Analysis
10.3.3. Estimated revenue from network security sandbox business and market share
10.3.4. Regional & business segment Revenue Analysis
10.4.McAfee
10.4.1. Company overview
10.4.2. Portfolio Analysis
10.4.3. Estimated revenue from network security sandbox business and market share
10.4.4. Regional & business segment Revenue Analysis
10.5. Symantec Corporation
10.5.1. Company overview
10.5.2. Portfolio Analysis
10.5.3. Estimated revenue from network security sandbox business and market share
10.5.4. Regional & business segment Revenue Analysis
10.6. FireEye Incorporated
10.6.1. Company overview
10.6.2. Portfolio Analysis
10.6.3. Estimated revenue from network security sandbox business and market share
10.6.4. Regional & business segment Revenue Analysis
10.7. Fortinet Incorporated
10.7.1. Company overview
10.7.2. Portfolio Analysis
10.7.3. Estimated revenue from network security sandbox business and market share
10.7.4. Regional & business segment Revenue Analysis
10.8. Sonic Wall
10.8.1. Company overview
10.8.2. Portfolio Analysis
10.8.3. Estimated revenue from network security sandbox business and market share
10.8.4. Regional & business segment Revenue Analysis
10.9. Palo Alto Networks Incorporated
10.9.1. Company overview
10.9.2. Portfolio Analysis
10.9.3. Estimated revenue from network security sandbox business and market share
10.9.4. Regional & business segment Revenue Analysis
PURCHASE OPTIONS
20% Free Customization ON ALL PURCHASE
*Terms & Conditions Apply
Looking for report on this market in a particular region or country? Get In Touch
Request Free Sample
Please fill in the form below to Request for free Sample Report
-
Office Hours Mon - Sat 10:00 - 16:00
-
Call Us +91 6201075429
-
Send Us Mail sales@marketdecipher.com
Market Decipher is a market research and consultancy firm involved in provision of market reports to organisations of varied sizes; small, large and medium.

© 2018 Market Decipher. All Rights Reserved