Precipitated Barium Sulphate Market Revenue, Sales Volume & Trend Forecasts Report, 2019-2026
Precipitated Barium Sulphate Market By Type (Modified barium sulphate, Ordinary precipitated barium sulphate, Nanometer precipitated barium sulphate and others), By Application (Rubber, coatings, plastics, and others), By Region (North America, Europe, APAC and Rest of the World)
- Report ID : MD1141 |
- Pages : 196 |
- Tables : 87 |
- Formats :


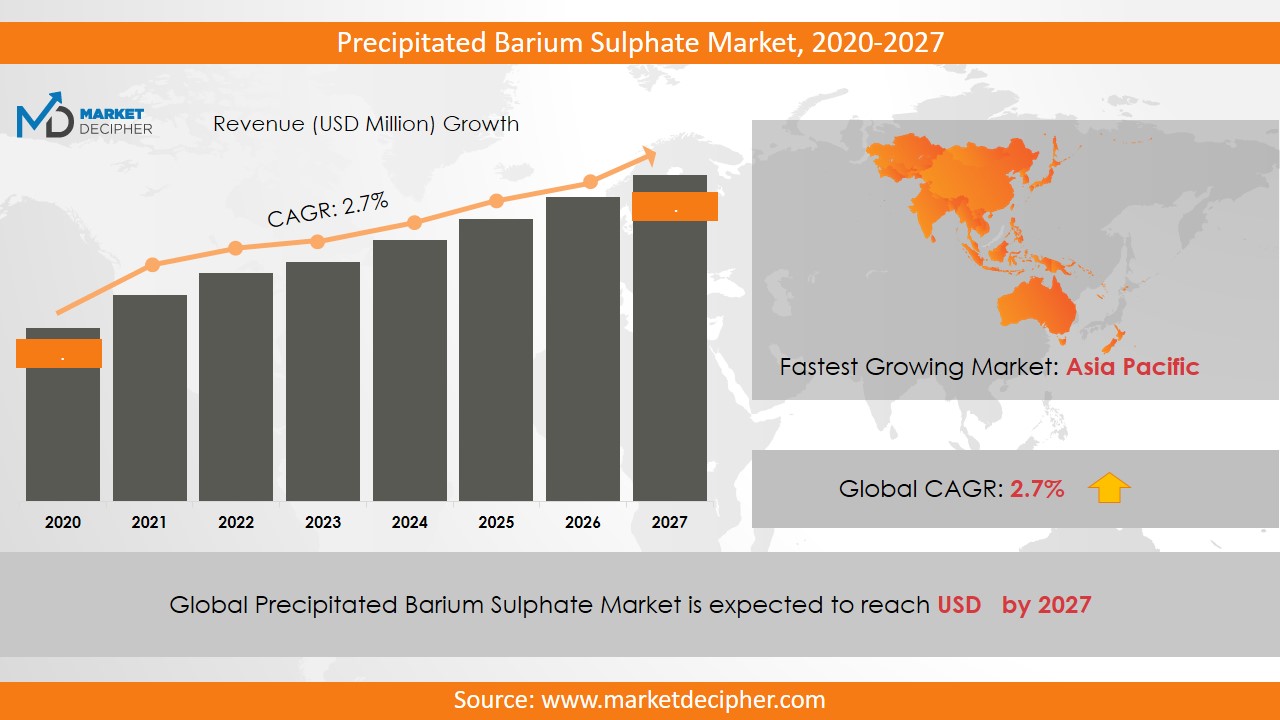
Precipitated Barium Sulphate market revenue shall reach a value of $XX Million in 2026, growing with a CAGR of XX.X% during the forecast period of 2019 to 2026. In terms of volume sales, the market is anticipated to reach XX Units.
Precipitated Barium Sulphate is easy to store as it is insoluble in water and it is odorless. It occurs in the form of colorless orthorhombic crystals sometimes as a white amorphous powder. It is highly soluble in hot concentrated sulphuric acid and not in other acids and ethanol. This allows insulation and prevents agglomeration and flocculation. Also, it provides better pigmentation on the surface on which it is applied. Precipitated barium sulphate is of specific particle size and is made by the precipitation of synthetic barium sulphate. The naturally occurring barium sulphate is commonly used in many industries. It has low absorption potential and thus gaining acceptance in several industries.
It provides high insulation to the surface where it is applied is anticipated which is expected to fuel up the precipitated barium sulphate market shares during the forecast period. Due to this property, it locates its wide application in rubber, coatings, plastics and other industries. Thus, these industries are anticipated to contribute significantly to increasing the precipitated barium sulphate market size during the forecast period. Moreover, the shifting preferences of the consumers towards the plastic products will further add on to the precipitated barium sulphate market sales.
REGIONAL ANALYSIS
The Asia Pacific dominated in terms of revenue in 2018. The rising industrialization in the region is driving the revenue of the market in North America. Asia Pacific region is the hub of various consumer electronic industries. Thus, this chemical is widely used in these industries for insulation and pigmentation purpose. Further, the North American region is anticipated to fuel up the market revenue significantly over the forecast period. Moreover, the Middle East African region is also anticipated to grow significantly over the forecast period owing to the rising development in industrial infrastructure.
SEGMENT ANALYSIS
Based on type, the market has been segmented as modified, ordinary, nanometer and others. Out of which, the nanometer segment has dominated the market revenue in 2018 and is expected to continue the same trend over the forecast period. Further, based on application, the market has been segmented as rubber, coatings, plastics, and others.
Further, the plastics industries have contributed significantly to the growth of the market revenue. Also, the coatings segment generated significant market revenue in recent years. Precipitated barium sulphate is widely used in the industries such as plastic, paper, pigmentation, paints & coatings, rubber, inks, leather, and ceramics industries owing to its properties such as high purity, high burning point, low oil absorption, insolubility in water, precise PH value, non-toxicity, longer shelf life and effectiveness.
INDUSTRY PLAYER ANALYSIS
Major industry players have been analyzed with coverage on their operating areas, revenues, and other strategic aspects. These industry players include Cimbar Performance Minerals, Barium & Chemicals, Inc., Solvay S.A, Shenzhou Jiaxin Chemical Co., Ltd., Fuhua Chem, Huntsman, Nadine, Sakai Chemicals, Jiaxin Chemicals, Nippon Chemical Industry, and Lianzhuang Technology. Various industry players are adopting advanced business strategies which will increase precipitated barium sulphate business size in the future.
COVERAGE HIGHLIGHTS
• Revenue Estimation and Forecast (2018 – 2026)
• Production Estimation and Forecast (2018 – 2026)
• Sales/Consumption Volume Estimation and Forecast (2018 – 2026)
• Breakdown of Revenue by Segments (2018 – 2026)
• Breakdown of Production by Segments (2018 – 2026)
• Breakdown of Sales Volume by Segments (2018 – 2026)
• Gross Margin and Profitability Analysis of Companies
• Business Trend and Expansion Analysis
• Import and Export Analysis
• Regional Analysis and Data Breakdown
SEGMENTAL ANALYSIS
By Type Outlook ($Revenue and Unit Sales, 2018-2026)
· Modified
· Ordinary
· Nanometer precipitated barium sulphate
· Others
By Application Outlook ($Revenue and Unit Sales, 2018-2026)
• Rubber
• Coatings
• Plastics
• Other industries
By Regional Outlook ($Revenue and Unit Sales, 2018-2026)
• North America
• Canada
• U.S
• Mexico
• Europe
• Germany
• U.K
• France
• Netherlands
• Austria
• Rest of Europe
• Asia-Pacific
• China
• India
• Japan
• South Korea
• Australia
• Rest of Asia Pacific
• The Middle East and Africa
• Saudi Arabia
• United Arab Emirates
• Rest of Middle East
• Africa
• South America
• Brazil
• Argentina
• Rest of South America
INDUSTRY PLAYERS ANALYSIS:
· Cimbar Performance Minerals
· Barium & Chemicals, Inc.
· Solvay S.A
· Shenzhou Jiaxin Chemical Co., Ltd.
· Fuhua Chem
· Huntsman
· NaFine
· Sakai Chemicals
· Jiaxin Chemicals
· Nippon Chemical Industry
· Lianzhuang Technology
CHAPTER 1. INTRODUCTION
1.1. RESEARCH METHODOLOGY
1.1.1. Data Collection
1.1.2. Data Modeling
1.1.3. Historical Revenue and Sales Estimation
1.1.4. Data Triangulation
1.2. RESEARCH PROCESS
1.2.1. Primary Research
1.2.2. Secondary Research
1.2.3. Survey Data
1.2.4. Validation by In-House Expert
1.3. PRECIPITATED BARIUM SULPHATE MARKET OVERVIEW
1.3.1. Research Scope and Market Definition
1.3.2. Executive Summary
CHAPTER 2. GLOBAL PRECIPITATED BARIUM SULPHATE MARKET DEMAND SIDE ANALYSIS
2.1. PRECIPITATED BARIUM SULPHATE MARKET CONSUMPTION VOLUME (MILLION UNITS), 2018 – 2025
2.2. MARKET CONSUMPTION VOLUME SPLIT BY REGION (MILLION UNITS), 2018 – 2025
2.3. MARKET CONSUMPTION VOLUME SPLIT BY COUNTRIES (MILLION UNITS), 2018 – 2025
2.4. MARKET REVENUE (MILLION USD), 2018-2025
2.5. MARKET REVENUE SPLIT BY REGION (MILLION UNITS), 2018 – 2025
2.6. PRECIPITATED BARIUM SULPHATE MARKET REVENUE SPLIT BY COUNTRIES (MILLION UNITS), 2018 – 2025
CHAPTER 3. GLOBAL PRECIPITATED BARIUM SULPHATE MARKET SUPPLY SIDE ANALYSIS
3.1. PRECIPITATED BARIUM SULPHATE MARKET PRODUCTION VOLUME (MILLION UNITS), 2018 – 2025
3.2. MARKET PRODUCTION VOLUME SPLIT BY REGION (MILLION UNITS), 2018-2025
3.3. MARKET PRODUCTION VOLUME SPLIT/RANKING BY COUNTRIES (MILLION UNITS), 2018 – 2025
CHAPTER 4. GLOBAL PRECIPITATED BARIUM SULPHATE MARKET COMPETITIVE SCENARIO & BUSINESS OPPORTUNITY ANALYSIS
4.1. COMPETITIVE STRENGTH RANKING BY MAJOR COUNTRIES, 2018
4.2. MARKET ATTRACTIVENESS RANKING BY MAJOR COUNTRIES, 2018 - 2025
4.3. EMERGING BUSINESS OPPORTUNITIES AND GROWTH PROSPECTS
4.3.1. Growth Drivers
4.3.2. Market Restraints
4.3.2. Opportunities
CHAPTER 5. GLOBAL PRECIPITATED BARIUM SULPHATE MARKET ENTRY STRATEGIES
5.1. ENTRY STRATEGIES IN DEVELOPING MARKETS
5.2. ENTRY STRATEGIES IN DEVELOPED MARKETS
CHAPTER 6. GLOBAL PRECIPITATED BARIUM SULPHATE MARKET BY TYPE
6.1. SEGMENT OUTLINE
6.2. REVENUE SHARE BY TYPE, $MILLION, 2018 – 2025
6.2. CONSUMPTION SHARE BY TYPE, MILLION UNITS, 2018 - 2025
6.3. PRODUCTION SHARE BY TYPE, MILLION UNITS, 2018 – 2025
6.4. MODIFIED BARIUM SULPHATE
6.4.1. Market determinants and trend analysis
6.4.2. Market revenue, sales and production volume, 2018 – 2025
6.5. ORDINARY PRECIPITATED BARIUM SULPHATE
6.5.1. Market determinants and trend analysis
6.5.2. Market revenue, sales and production volume, 2018 – 2025
6.6. NANOMETER PRECIPITATED BARIUM SULPHATE
6.6.1. Market determinants and trend analysis
6.6.2. Market revenue, sales and production volume, 2018 – 2025
6.7. OTHERS
6.7.1. Market determinants and trend analysis
6.7.2. Market revenue, sales and production volume, 2018 – 2025
CHAPTER 7. GLOBAL PRECIPITATED BARIUM SULPHATE MARKET BY APPLICATION
7.1. SEGMENT OUTLINE
7.2. REVENUE SHARE BY APPLICATION, $MILLION, 2018 – 2025
7.2. CONSUMPTION SHARE BY APPLICATION, MILLION UNITS, 2018 - 2025
7.3. PRODUCTION SHARE BY APPLICATION, MILLION UNITS, 2018 – 2025
7.4. RUBBER
7.4.1. Market determinants and trend analysis
7.4.2. Market revenue, sales and production volume, 2018 – 2025
7.5. COATINGS
7.5.1. Market determinants and trend analysis
7.5.2. Market revenue, sales and production volume, 2018 – 2025
7.6. PLASTICS
7.6.1. Market determinants and trend analysis
7.6.2. Market revenue, sales and production volume, 2018 – 2025
7.7. OTHER INDUSTRIES
7.7.1. Market determinants and trend analysis
7.7.2. Market revenue, sales and production volume, 2018 – 2025
CHAPTER 8. GLOBAL PRECIPITATED BARIUM SULPHATE MARKET BY REGIONS
8.1. REGIONAL OUTLOOK
8.2. MARKET PRODUCTION, CONSUMPTION & REVENUE BY REGION, 2018-2025
8.3. NORTH AMERICA
8.3.1. Current Trends and Future Prospects
8.3.2. North America market revenue, sales and production volume, 2018 – 2025
8.3.3. The U.S.
8.3.3.1. Precipitated Barium Sulphate Market Revenue $Million (2018 – 2025)
8.3.3.2. Precipitated Barium Sulphate Market Consumption Million Units (2018 – 2025)
8.3.3.3. Precipitated Barium Sulphate Market Production Million Units (2018 – 2025)
8.3.4. Canada
8.3.4.1. Precipitated Barium Sulphate Market Revenue $Million (2018 – 2025)
8.3.4.2. Precipitated Barium Sulphate Market Consumption Million Units (2018 – 2025)
8.3.4.3. Precipitated Barium Sulphate Market Production Million Units (2018 – 2025)
8.3.5. Mexico
8.3.5.1. Precipitated Barium Sulphate Market Revenue $Million (2018 – 2025)
8.3.5.2. Precipitated Barium Sulphate Market Consumption Million Units (2018 – 2025)
8.3.5.3. Precipitated Barium Sulphate Market Production Million Units (2018 – 2025)
8.4. EUROPE
8.4.1. Current Trends and Future Prospects
8.4.2. Europe market revenue, sales and production volume, 2018 – 2025
8.4.3. U.K
8.4.3.1. Precipitated Barium Sulphate Market Revenue $Million (2018 – 2025)
8.4.3.2. Precipitated Barium Sulphate Market Consumption Million Units (2018 – 2025)
8.4.3.3. Precipitated Barium Sulphate Market Production Million Units (2018 – 2025)
8.4.4. Germany
8.4.4.1. Precipitated Barium Sulphate Market Revenue $Million (2018 – 2025)
8.4.4.2. Precipitated Barium Sulphate Market Consumption Million Units (2018 – 2025)
8.4.4.3. Precipitated Barium Sulphate Market Production Million Units (2018 – 2025)
8.4.5. France
8.4.5.1. Precipitated Barium Sulphate Market Revenue $Million (2018 – 2025)
8.4.5.2. Precipitated Barium Sulphate Market Consumption Million Units (2018 – 2025)
8.4.5.3. Precipitated Barium Sulphate Market Production Million Units (2018 – 2025)
8.4.6. Italy
8.4.6.1. Precipitated Barium Sulphate Market Revenue $Million (2018 – 2025)
8.4.6.2. Precipitated Barium Sulphate Market Consumption Million Units (2018 – 2025)
8.4.6.3. Precipitated Barium Sulphate Market Production Million Units (2018 – 2025)
8.4.7. Rest of Europe
8.4.7.1. Precipitated Barium Sulphate Market Revenue $Million (2018 – 2025)
8.4.7.2. Precipitated Barium Sulphate Market Consumption Million Units (2018 – 2025)
8.4.7.3. Precipitated Barium Sulphate Market Production Million Units (2018 – 2025)
8.5. ASIA PACIFIC
8.5.1. Current Trends and Future Prospects
8.5.2. Europe market revenue, sales and production volume, 2018 – 2025
8.5.3. India
8.5.3.1. Precipitated Barium Sulphate Market Revenue $Million (2018 – 2025)
8.5.3.2. Precipitated Barium Sulphate Market Consumption Million Units (2018 – 2025)
8.5.3.3. Precipitated Barium Sulphate Market Production Million Units (2018 – 2025)
8.5.4. Japan
8.5.4.1. Precipitated Barium Sulphate Market Revenue $Million (2018 – 2025)
8.5.4.2. Precipitated Barium Sulphate Market Consumption Million Units (2018 – 2025)
8.5.4.3. Precipitated Barium Sulphate Market Production Million Units (2018 – 2025)
8.5.5. China
8.5.5.1. Precipitated Barium Sulphate Market Revenue $Million (2018 – 2025)
8.5.5.2. Precipitated Barium Sulphate Market Consumption Million Units (2018 – 2025)
8.5.5.3. Precipitated Barium Sulphate Market Production Million Units (2018 – 2025)
8.5.6. South Korea
8.5.6.1. Precipitated Barium Sulphate Market Revenue $Million (2018 – 2025)
8.5.6.2. Precipitated Barium Sulphate Market Consumption Million Units (2018 – 2025)
8.5.6.3. Precipitated Barium Sulphate Market Production Million Units (2018 – 2025)
8.5.7. Rest of APAC
8.5.7.1. Precipitated Barium Sulphate Market Revenue $Million (2018 – 2025)
8.5.7.2. Precipitated Barium Sulphate Market Consumption Million Units (2018 – 2025)
8.5.7.3. Precipitated Barium Sulphate Market Production Million Units (2018 – 2025)
8.6. REST OF THE WORLD
8.6.1. Current Trends and Future Prospects
8.6.2. Europe market revenue, sales and production volume, 2018 – 2025
8.6.3. Latin America
8.6.3.1. Precipitated Barium Sulphate Market Revenue $Million (2018 – 2025)
8.6.3.2. Precipitated Barium Sulphate Market Consumption Million Units (2018 – 2025)
8.6.3.3. Precipitated Barium Sulphate Market Production Million Units (2018 – 2025)
8.6.4. Middle East
8.6.4.1. Precipitated Barium Sulphate Market Revenue $Million (2018 – 2025)
8.6.4.2. Precipitated Barium Sulphate Market Consumption Million Units (2018 – 2025)
8.6.4.3. Precipitated Barium Sulphate Market Production Million Units (2018 – 2025)
8.6.5. Africa
8.6.5.1. Precipitated Barium Sulphate Market Revenue $Million (2018 – 2025)
8.6.5.2. Precipitated Barium Sulphate Market Consumption Million Units (2018 – 2025)
8.6.5.3. Precipitated Barium Sulphate Market Production Million Units (2018 – 2025)
CHAPTER 9. KEY VENDOR PROFILES
9.1. Cimbar Performance Minerals
9.1.1. Company overview
9.1.2. Portfolio Analysis
9.1.3. Estimated revenue from barium precipitated sulphate business and market share
9.1.4. Regional & business segment Revenue Analysis
9.2. Barium & Chemicals, Inc.
9.2.1. Company overview
9.2.2. Portfolio Analysis
9.2.3. Estimated revenue from precipitated barium sulphate business and market share
9.2.4. Regional & business segment Revenue Analysis
9.3. Solvay S.A
9.3.1. Company overview
9.3.2. Portfolio Analysis
9.3.3. Estimated revenue from precipitated barium sulphate business and market share
9.3.4. Regional & business segment Revenue Analysis
9.4. Shenzhou Jiaxin Chemical Co., Ltd.
9.4.1. Company overview
9.4.2. Portfolio Analysis
9.4.3. Estimated revenue from precipitated barium sulphate business and market share
9.4.4. Regional & business segment Revenue Analysis
9.5. Fuhua Chem
9.5.1. Company overview
9.5.2. Portfolio Analysis
9.5.3. Estimated revenue from precipitated barium sulphate business and market share
9.5.4. Regional & business segment Revenue Analysis
9.6. Huntsman
9.6.1. Company overview
9.6.2. Portfolio Analysis
9.6.3. Estimated revenue from precipitated barium sulphate business and market share
9.6.4. Regional & business segment Revenue Analysis
9.7.NaFine
9.7.1. Company overview
9.7.2. Portfolio Analysis
9.7.3. Estimated revenue from precipitated barium sulphate business and market share
9.7.4. Regional & business segment Revenue Analysis
9.8. Sakai Chemicals
9.8.1. Company overview
9.8.2. Portfolio Analysis
9.8.3. Estimated revenue from precipitated barium sulphate business and market share
9.8.4. Regional & business segment Revenue Analysis
9.9. Jiaxin Chemicals
9.9.1. Company overview
9.9.2. Portfolio Analysis
9.9.3. Estimated revenue from precipitated barium sulphate business and market share
9.9.4. Regional & business segment Revenue Analysis
9.10. Nippon Chemical Industry
9.10.1. Company overview
9.10.2. Portfolio Analysis
9.10.3. Estimated revenue from precipitated barium sulphate business and market share
9.10.4. Regional & business segment Revenue Analysis
9.11. Lianzhuang Technology
9.11.1. Company overview
9.11.2. Portfolio Analysis
9.11.3. Estimated revenue from precipitated barium sulphate business and market share
9.11.4. Regional & business segment Revenue Analysis
PURCHASE OPTIONS
20% Free Customization ON ALL PURCHASE
*Terms & Conditions Apply
Looking for report on this market in a particular region or country? Get In Touch
Request Free Sample
Please fill in the form below to Request for free Sample Report
-
Office Hours Mon - Sat 10:00 - 16:00
-
Call Us +91 6201075429
-
Send Us Mail sales@marketdecipher.com
Market Decipher is a market research and consultancy firm involved in provision of market reports to organisations of varied sizes; small, large and medium.

© 2018 Market Decipher. All Rights Reserved