Precision Gearbox Market Size, Statistics, Trend Analysis and Forecast Report, 2020 - 2027
By Product (Parallel, Planetary, Right Angle), By Application (Food Beverage & Tobacco, Military & Aerospace, Material Handling, Packaging, Machine Tools, Medical, Robotics), Industry Outlook Report, Regional Analysis (U.S., Canada, France, U.K., Germany, Italy, Ireland, Belarus, Latvia, Denmark, Croatia, Romania, China, India, Uzbekistan, Japan, Tajikistan, Philippines,Singapore, Cambodia, Australia, New Zealand, Brazil, Argentina, Chile, Peru, South Africa, Egypt, Iran, Morocco)
- Report ID : MD1452 |
- Pages : 240 |
- Tables : 85 |
- Formats :


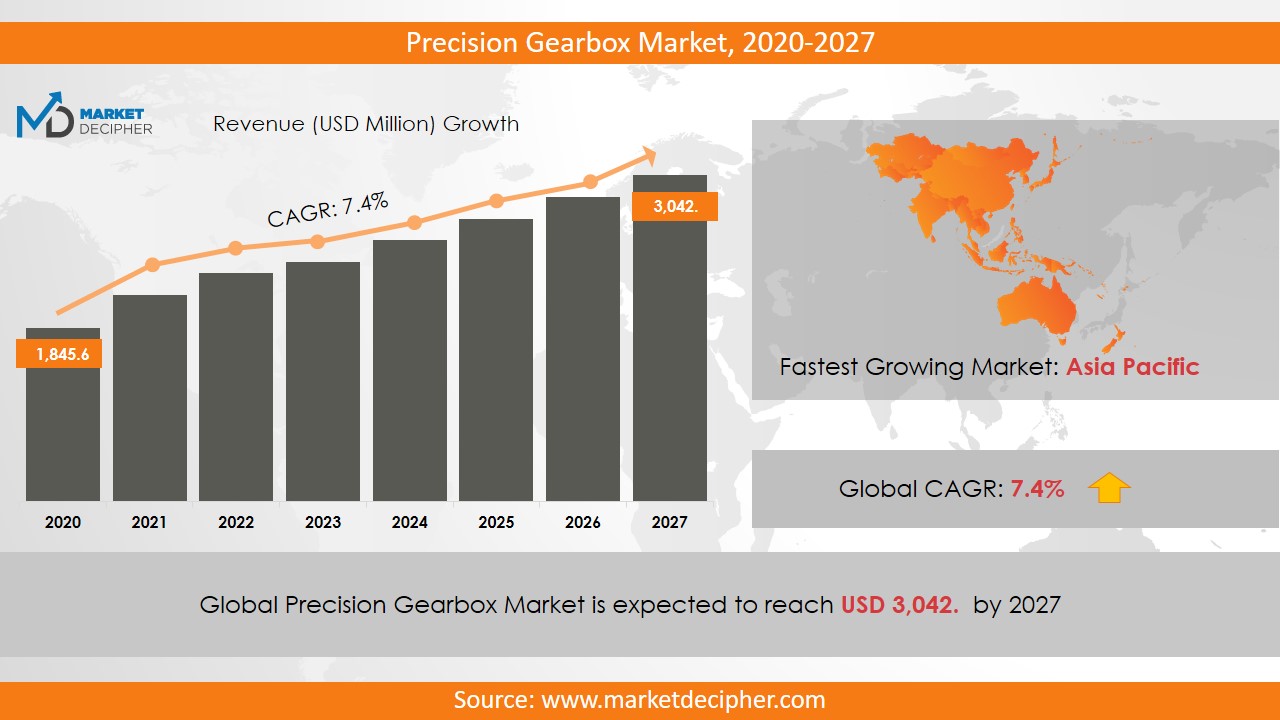
Precision Gearbox Market size was estimated at $2,402.5 Million in 2019 and is expected to reach $3,269.5 Million by 2027, growing at a CAGR of 4.5% during the forecast period of 2020 to 2027.
The basic underlying principle of Precision Gearbox is the same as a standard gearbox. Two gears of different diameters are in mesh with each other and when one rotates and causes motion in the other, the torques vary. Automation demands require precision gearboxes as their tolerance is immaculate and the gear ratios are very specific. The growth of the automation sector is directly proportional to the demand for Precision Gearboxes. One of the pitfalls is the increasing adoption of direct drives.
Analysis by Product
According to the Product, the three segments are Parallel, Planetary, and Right Angle. The Precision Gearbox market report claims that the Planetary gearbox has a clear dominance in this industry owing to its unmatched reliability for a wide range of utilizations. The Precision Gearbox market research has a robust analysis of the superior performance of these Gearboxes over other segments. They can be run for several hours before needing routine maintenance. The Precision Gearbox market share of the right-angle segment is likely to grow in spatially-challenged applications. Thus, these are bound to find use in machine tools and packaging space. Their flexibility is the greatest asset.
Analysis by Application
The seven segments by Application are Food Beverage & Tobacco, Military & Aerospace, Material Handling, Packaging, Machine Tools, Medical, and Robotics. The Precision Gearbox Market size is the largest in Robotics applications owing to the widespread utilization of industrial robots in heavy industries such as turbine manufacturing. The Precision Gearbox market estimation is very buoyant for this segment as they fulfill an inelastic demand. This segment cannot do without Precision Gearboxes and is thus, touted to be at the forefront of growth.
Analysis by Region
The Asia-Pacific region contributes nearly 45% of the revenue acquired from Precision Gearboxes as India, China, and Japan are rapidly incorporating automation in their industries. The Precision Gearbox market forecast is very promising because of the deployment of heavy-metal handling industries and greenfield projects with better design. The companies have already started developing new industrial corridors with modern automation built-in. This is likely to propel the Precision Gearbox price trend towards a lucrative business opportunity for the players in this industry. Businesses are realizing the long-term benefits of Industrial Automation vis-à-vis Manual intervention. It has tax advantages such as Asset creation, Depreciation expense, and Accelerated depreciation in certain cases. Moreover, it delivers better quality control in manufacturing applications that need precision as well as speed of production.
Analysis by Renowned Businesses
The leading Precision Gearboxes companies are SEW Eurodrive, Siemens, and Brevini. Other manufacturers have regional footprints. They hold a decent market share in the geographies of their operation. Even regional manufacturers spend judiciously on R&D activities to enhance their toplines. This goes to show the highly specialized nature of this industry and the corresponding importance of the availability of vertically-specialized Human Resources. Another value-chain being explored by many companies is that of models. These are specific demands from Military & Aerospace, Medical, and Robotics industries for modeling. Strategic collaborations with prospective high-ticket clients can be extremely rewarding in the future when large, commercial orders are placed.
COVERAGE HIGHLIGHTS
• Market Revenue Estimation and Forecast (2019 – 2026)
• Market Production Estimation and Forecast (2019 – 2026)
• Market Sales/Consumption Volume Estimation and Forecast (2019 – 2026)
• Breakdown of Revenue by Segments (2019 – 2026)
• Breakdown of Production by Segments (2019 – 2026)
• Breakdown of Sales Volume by Segments (2019 – 2026)
• Gross Margin and Profitability Analysis of Companies
• Business Trend and Expansion Analysis
• Import and Export Analysis
• Regional Analysis and Market Data Breakdown
MARKET SEGMENTATION
By Product Outlook ($Revenue and Unit Sales, 2019-2026)
• Parallel
• Planetary
• Right Angle
By Application Outlook ($Revenue and Unit Sales, 2019-2026)
• Food Beverage & Tobacco
• Military & Aerospace
• Material Handling
• Packaging
• Machine Tools
• Medical
• Robotics
By Regional Outlook ($Revenue and Unit Sales, 2019-2026)
• North America
o U.S.
o Canada
• Europe
o France
o U.K.
o Germany
o Italy
o Ireland
o Belarus
o Latvia
o Denmark
o Croatia
o Romania
• Asia-Pacific
o China
o India
o Uzbekistan
o Japan
o Tajikistan
o Philippines
o Singapore
o Cambodia
o Australia
o New Zealand
• Latin America
o Brazil
o Argentina
o Chile
o Peru
• Middle East & Africa
o South Africa
o Egypt
o Iran
o Morocco
Renowned Businesses
• ABB Ltd
• Bonfiglioli
• Emerson
• Rexnord
• SEW Eurodrive
• Siemens
• Brevini Power Transmission
• Cone Drive Operations
• Curtis Machine Company
• David Brown Engineering
• Horsburgh & Scott
• Oerlikon Graziano Drive Systems
CHAPTER 1: INTRODUCTION
1.1. RESEARCH METHODOLOGY
1.1.1. Desk Research
1.1.2. Data Synthesis
1.1.3. Data Validation & Market Feedback
1.1.4. Data Sources
CHAPTER 2: EXECUTIVE SUMMARY
2.1. GLOBAL MARKET OUTLOOK
2.2. CORE INSIGHTS –DELIVERY MODEL
2.3. CORE INSIGHTS – PRECISION GEARBOX
2.4. CORE INSIGHTS – SERVICE PROVIDER
2.5. CORE INSIGHTS – GEOGRAPHY
CHAPTER 3: MARKET OVERVIEW
3.1. MARKET DEFINITION AND SCOPE
3.2. KEY FORCES SHAPING THE INDUSTRY
3.2.1. Bargaining Power of Suppliers
3.2.2. Bargaining Power of Buyers
3.2.3. Threat of Substitutes
3.2.4. Threat of New Entrants
3.3. MARKET DYNAMICS
3.3.1. Drivers
3.3.1.1. Supply-side Drivers
3.3.1.2. Demand-side Drivers
3.3.2. Restraints
3.3.3. Opportunities
3.4. INDUSTRY - ANALYSIS
3.4.1. Political Market
3.4.2. Environmental Market
3.4.3. Social Market
3.4.4. Technology Market
CHAPTER 4: MARKET BACKGROUND
4.1. Industry Value Chain Analysis
4.1.1. Upstream Participants
4.1.2. Downstream participants
4.2. Pricing Analysis and Forecast, 2019-2026
4.2.1. By Type
4.2.2. By Region
CHAPTER 5: PRECISION GEARBOX MARKET, BY PRODUCT OUTLOOK
5.1. Overview
5.1.1. Market Revenue (US$ Million) and Forecast, 2019-2026
5.2. Parallel
5.2.1. Key Market Trends, Growth Factors and Opportunities
5.2.2. Market Revenue (US$ Million) and Forecast, By Region
5.3. Planetary
5.3.1. Key Market Trends, Growth Factors and Opportunities
5.3.2. Market Revenue (US$ Million) and Forecast, By Region
5.4. Right Angle
5.4.1. Key Market Trends, Growth Factors and Opportunities
5.4.2. Market Revenue (US$ Million) and Forecast, By Region
CHAPTER 6: PRECISION GEARBOX MARKET BY APPLICATION OUTLOOK
6.1. Overview
6.1.1. Market Revenue (US$ Million) and Forecast, 2019-2026
6.2. Food Beverage & Tobacco
6.2.1. Key Market Trends, Growth Factors and Opportunities
6.2.2. Market Revenue (US$ Million) and Forecast, By Region
6.3. Military & Aerospace
6.3.1. Key Market Trends, Growth Factors and Opportunities
6.3.2. Market Revenue (US$ Million) and Forecast, By Region
6.4. Material Handling
6.4.1. Key Market Trends, Growth Factors and Opportunities
6.4.2. Market Revenue (US$ Million) and Forecast, By Region
6.5. Packaging
6.5.1. Key Market Trends, Growth Factors and Opportunities
6.5.2. Market Revenue (US$ Million) and Forecast, By Region
6.6. Machine Tools
6.6.1. Key Market Trends, Growth Factors and Opportunities
6.6.2. Market Revenue (US$ Million) and Forecast, By Region
6.7. Medical
6.7.1. Key Market Trends, Growth Factors and Opportunities
6.7.2. Market Revenue (US$ Million) and Forecast, By Region
6.8. Robotics
6.8.1. Key Market Trends, Growth Factors and Opportunities
6.8.2. Market Revenue (US$ Million) and Forecast, By Region
CHAPTER 7: PRECISION GEARBOX MARKET, BY GEOGRAPHY
7.1. Overview
7.2. North America
7.2.1. Key Market Trends, Growth Factors and Opportunities
7.2.2. Market Revenue and Forecast, By Delivery Model
7.2.3. Market Revenue and Forecast, By Agriculture Type
7.2.4. Market Revenue and Forecast, By Service Provider
7.2.5. Market Revenue and Forecast, By Country
7.2.6. U.S.
7.2.6.1. Market Revenue and Forecast
7.2.7. Canada
7.2.7.1. Market Revenue and Forecast
7.2.8. Mexico
7.2.8.1. Market Revenue and Forecast
7.3. Europe
7.3.1. Market Revenue and Forecast, By Delivery Model
7.3.2. Market Revenue and Forecast, By Agriculture Type
7.3.3. Market Revenue and Forecast, By Service Provider
7.3.4. Market Revenue and Forecast, By Country
7.3.5. Germany
7.3.5.1. Market Revenue and Forecast
7.3.6. UK
7.3.6.1. Market Revenue and Forecast
7.3.7. France
7.3.7.1. Market Revenue and Forecast
7.3.8. Italy
7.3.8.1. Market Revenue and Forecast
7.3.9. Spain
7.3.9.1. Market Revenue and Forecast
7.3.10. Poland
7.3.10.1. Market Revenue and Forecast
7.3.11. Austrai
7.3.11.1. Market Revenue and Forecast
7.3.12. Luxembourg
7.3.12.1. Market Revenue and Forecast
7.3.13. Rest of Europe
7.3.13.1. Market Revenue and Forecast
7.4. Asia-Pacific
7.4.1. Market Revenue and Forecast, By Delivery Model
7.4.2. Market Revenue and Forecast, By Agriculture Type
7.4.3. Market Revenue and Forecast, By Service Provider
7.4.4. Market Revenue and Forecast, By Country
7.4.5. China
7.4.5.1. Market Revenue and Forecast
7.4.6. India
7.4.6.1. Market Revenue and Forecast
7.4.7. Japan
7.4.7.1. Market Revenue and Forecast
7.4.8. South Korea
7.4.8.1. Market Revenue and Forecast
7.4.9. Rest of APAC
7.4.9.1. Market Revenue and Forecast
7.5. REST OF THE WORLD
7.5.1. Market Revenue and Forecast, By Delivery Model
7.5.2. Market Revenue and Forecast, By Agriculture Type
7.5.3. Market Revenue and Forecast, By Service Provider
7.5.4. Market Revenue and Forecast, By Country
7.5.5. Latin America
7.5.5.1. Market Revenue and Forecast
7.5.6. Middle East
7.5.6.1. Market Revenue and Forecast
7.5.7. Africa
7.5.7.1. Market Revenue and Forecast
CHAPTER 8: COMPANY PROFILES
8.1. Airbus S.A.S
8.1.1. Company Overview
8.1.2. Financial Performance
8.1.3. SWOT Analysis
8.2. Aviation Industry Corporation of China Ltd. (AVIC)
8.2.1. Company Overview
8.2.2. Financial Performance
8.2.3. SWOT Analysis
8.3. Astronics Corporation
8.3.1. Company Overview
8.3.2. Financial Performance
8.3.3. SWOT Analysis
8.4. Boeing
8.4.1. Company Overview
8.4.2. Financial Performance
8.4.3. SWOT Analysis
8.5. Ball Corporation
8.5.1. Company Overview
8.5.2. Financial Performance
8.5.3. SWOT Analysis
8.6. BAE Systems
8.6.1. Company Overview
8.6.2. Financial Performance
8.6.3. SWOT Analysis
8.7. Cobham plc
8.7.1. Company Overview
8.7.2. Financial Performance
8.7.3. SWOT Analysis
8.8. Curtiss Wright
8.8.1. Company Overview
8.8.2. Financial Performance
8.8.3. SWOT Analysis
8.9. Elbit System
8.9.1. Company Overview
8.9.2. Financial Performance
8.9.3. SWOT Analysis
8.10. Gramin Ltd
8.10.1. Company Overview
8.10.2. Financial Performance
8.10.3. SWOT Analysis
8.11. GE Aviation
8.11.1. Company Overview
8.11.2. Financial Performance
8.11.3. SWOT Analysis
8.12. Harris Corporation
8.12.1. Company Overview
8.12.2. Financial Performance
8.12.3. SWOT Analysis
8.13. Honeywell International Inc.
8.13.1. Company Overview
8.13.2. Financial Performance
8.13.3. SWOT Analysis
8.14. Lockheed Martin Corporation
8.14.1. Company Overview
8.14.2. Financial Performance
8.14.3. SWOT Analysis
8.15. L3 Harris Corporation
8.15.1. Company Overview
8.15.2. Financial Performance
8.15.3. SWOT Analysis
8.16. Meggitt PLC
8.16.1. Company Overview
8.16.2. Financial Performance
8.16.3. SWOT Analysis
8.17. Northrop Grumman Corporation
8.17.1. Company Overview
8.17.2. Financial Performance
8.17.3. SWOT Analysis
8.18. Nucon Aerospace
8.18.1. Company Overview
8.18.2. Financial Performance
8.18.3. SWOT Analysis
8.19. Panasonic Corporation
8.19.1. Company Overview
8.19.2. Financial Performance
8.19.3. SWOT Analysis
8.20. Rolls Royce
8.20.1. Company Overview
8.20.2. Financial Performance
8.20.3. SWOT Analysis
8.21. Raytheon Company
8.21.1. Company Overview
8.21.2. Financial Performance
8.21.3. SWOT Analysis
8.22. Saab AB
8.22.1. Company Overview
8.22.2. Financial Performance
8.22.3. SWOT Analysis
8.23. Safran
8.23.1. Company Overview
8.23.2. Financial Performance
8.23.3. SWOT Analysis
8.24. Thales Group
8.24.1. Company Overview
8.24.2. Financial Performance
8.24.3. SWOT Analysis
8.25. Teledyne Technologies Inc.
8.25.1. Company Overview
8.25.2. Financial Performance
8.25.3. SWOT Analysis
8.26. Transdigm Group Inc.
8.26.1. Company Overview
8.26.2. Financial Performance
8.26.3. SWOT Analysis
PURCHASE OPTIONS
20% Free Customization ON ALL PURCHASE
*Terms & Conditions Apply
Looking for report on this market in a particular region or country? Get In Touch
Request Free Sample
Please fill in the form below to Request for free Sample Report
-
Office Hours Mon - Sat 10:00 - 16:00
-
Call Us +91 6201075429
-
Send Us Mail sales@marketdecipher.com
Market Decipher is a market research and consultancy firm involved in provision of market reports to organisations of varied sizes; small, large and medium.

© 2018 Market Decipher. All Rights Reserved