Recycling Equipment & Machinery Market Size, Statistics, Trend Analysis and Forecast Report, 2020 - 2027
By Machine (Baler Presses, Shears, Shredders, Extruders, Agglomerators, Granulators), By Processed Material (Wood Paper & Cardboard, Plastic, Rubber, Ferrous & Non-Ferrous), Industry Outlook Report, Regional Analysis (U.S., Canada, Mexico, U.K., Germany, France, Italy, Portugal, Russia, The Netherlands, India, Japan, China, South Korea, Thailand, Malaysia, Brazil, Argentina, South Africa, U.A.E., Iran, Kenya)
- Report ID : MD1454 |
- Pages : 240 |
- Tables : 85 |
- Formats :


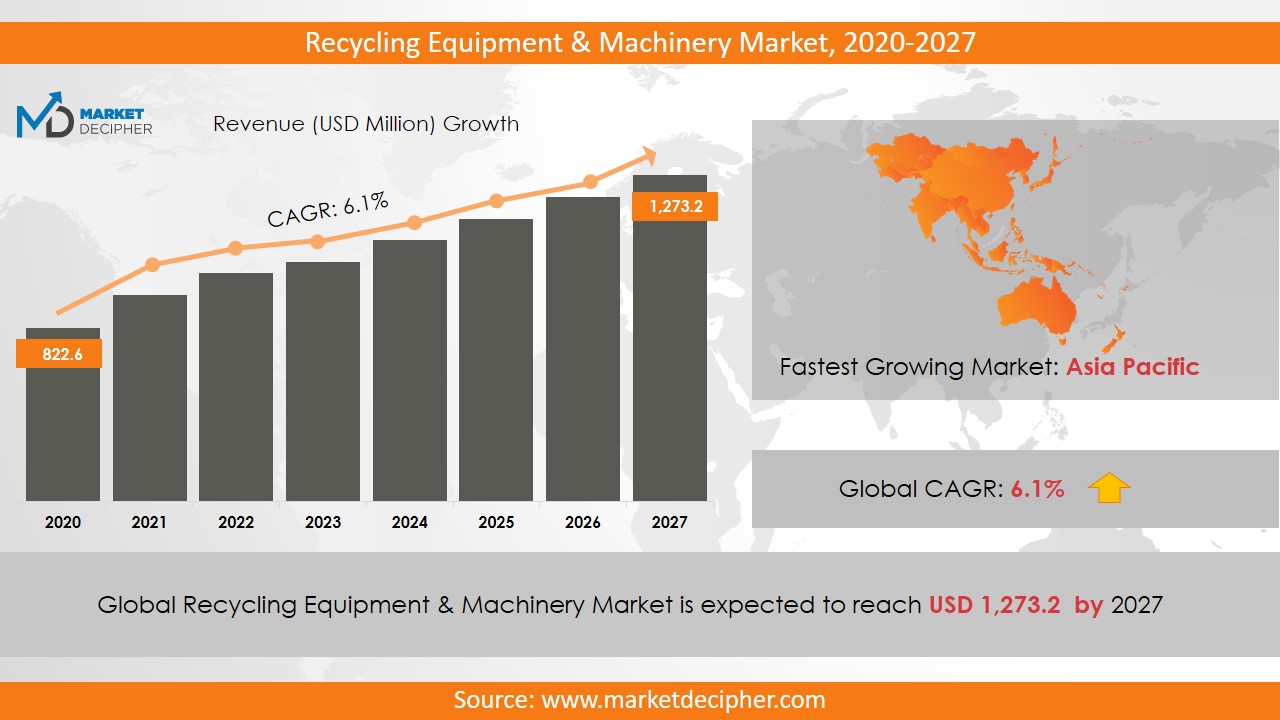
Recycling Equipment & Machinery Market size was estimated at $786.6 Million in 2019 and is expected to reach $1,182.7 Million by 2027, growing at a CAGR of 6% during the forecast period of 2020 to 2027.
Recycling Equipment & Machinery is used by many component manufacturing companies to process raw materials from a discarded source, to form the desired finished goods. Increasing government incentives to recycle spent plastics and rubber is likely to be a key driver in the growth of this industry. Also, the raw materials are available at competitive prices which is likely to boost demand. One of the restraints is the lack of awareness among the end-users about the merits of recycling. Also, it is a popular myth among consumers that products made out of recycled raw materials are inferior in quality. This is a challenge that needs to be overcome by a strong marketing plan.
Analysis by Machine
According to the Machine, the segments are Baler Presses, Shears, Shredders, Extruders, Agglomerators, and Granulators.The Recycling Equipment & Machinery market report suggests the prevalence of Baler presses owing to their superior ability to process waste plastic. They compress waste into bales, thereby easing the handling of the processed product. The Recycling Equipment & Machinery market research indicates a bullish demand for shredders as well, mostly from the mining industry. Extruders are found after the shredder in the operational value-chain for the production of plastic pellets. These will show a moderate growth rate owing to a stable consumption of home-use plastics.
Analysis by Processed Materials
According to the Processed Materials, the categories are Wood Paper & Cardboard, Plastic, Rubber, and Ferrous & Non-Ferrous.Close to half of the Recycling Equipment & Machinery market share is held by Plastics. Moreover, various government drives for cleaning up the menace caused by them is likely to increase its share further. The Recycling Equipment & Machinery market size of Ferrous & Non-Ferrous metals will grow substantially as there are fairly strong indication of urbanization in certain specific geographies around the world. It brings benefits such as reduced emissions and energy consumption.
Analysis by Region
The Recycling Equipment & Machinery market estimation is fairly bullish for the European market. The robust initiatives against plastic waste proliferation is likely to garner a large demand. The Recycling Equipment & Machinery market forecast suggests that close to 10 million tons of plastic will be recycled every year in the period under consideration.
The Asia-Pacific region, led by China, will emerge as a remunerative region for this industry owing to rapid urbanization. Thus, the Recycling Equipment & Machinery price trend is expected to become favorable for the participants. New recycling businesses are very likely to be set up in this region owing to the abundant availability of plastics.
Analysis by Acclaimed Organizations
The leading Recycling Equipment & Machinery companies are Forrec Srl Recycling, Lefort, BHS Sonthofen, and Mid Atlantic Waste Systems.
This industry has a reasonably large number of companies with product customizations for specific end-uses. It is common to see organizations investing in new production centers in foreign geographies as the underlying processes are very streamlined and generic. Additionally, the recycling input materials are universally found in almost all countries. The grades of these raw materials are also sufficiently generalized. Another trend that is likely to play out is that of Acquisitions by larger MNCs in demand-intensive regions.
COVERAGE HIGHLIGHTS
• Market Revenue Estimation and Forecast (2019 – 2026)
• Market Production Estimation and Forecast (2019 – 2026)
• Market Sales/Consumption Volume Estimation and Forecast (2019 – 2026)
• Breakdown of Revenue by Segments (2019 – 2026)
• Breakdown of Production by Segments (2019 – 2026)
• Breakdown of Sales Volume by Segments (2019 – 2026)
• Gross Margin and Profitability Analysis of Companies
• Business Trend and Expansion Analysis
• Import and Export Analysis
• Regional Analysis and Market Data Breakdown
MARKET SEGMENTATION
By Machine Outlook ($Revenue and Unit Sales, 2019-2026)
• Baler Presses
• Shears
• Shredders
• Extruders
• Agglomerators
• Granulators
By Processed Materials Outlook ($Revenue and Unit Sales, 2019-2026)
• Wood Paper & Cardboard
• Plastic
• Rubber
• Ferrous & Non-Ferrous
By Regional Outlook ($Revenue and Unit Sales, 2019-2026)
• North America
o U.S.
o Canada
o Mexico
• Europe
o U.K.
o Germany
o France
o Italy
o Portugal
o Russia
o The Netherlands
• Asia-Pacific
o India
o Japan
o China
o South Korea
o Thailand
o Malaysia
• Latin America
o Brazil
o Argentina
• Middle East & Africa
o South Africa
o U.A.E.
o Iran
o Kenya
Acclaimed Organizations
• Danieli Centro Recycling
• Lefort
• Mortia Holdings Corporation
• MTB Recycling
• Forrec Srl Recycling Systems
• BHS Sonthofen
• Indromec Spa
• Suny Group
• Roter Recycling
• Vecoplan AG
• Shred-Tech Corporation
• GAMMA MECCANICA S.P.A.
CHAPTER 1: INTRODUCTION
1.1. RESEARCH METHODOLOGY
1.1.1. Desk Research
1.1.2. Data Synthesis
1.1.3. Data Validation & Market Feedback
1.1.4. Data Sources
CHAPTER 2: EXECUTIVE SUMMARY
2.1. GLOBAL MARKET OUTLOOK
2.2. CORE INSIGHTS –DELIVERY MODEL
2.3. CORE INSIGHTS – RECYCLING EQUIPMENT & MACHINERY
2.4. CORE INSIGHTS – SERVICE PROVIDER
2.5. CORE INSIGHTS – GEOGRAPHY
CHAPTER 3: MARKET OVERVIEW
3.1. MARKET DEFINITION AND SCOPE
3.2. KEY FORCES SHAPING THE INDUSTRY
3.2.1. Bargaining Power of Suppliers
3.2.2. Bargaining Power of Buyers
3.2.3. Threat of Substitutes
3.2.4. Threat of New Entrants
3.3. MARKET DYNAMICS
3.3.1. Drivers
3.3.1.1. Supply-side Drivers
3.3.1.2. Demand-side Drivers
3.3.2. Restraints
3.3.3. Opportunities
3.4. INDUSTRY - ANALYSIS
3.4.1. Political Market
3.4.2. Environmental Market
3.4.3. Social Market
3.4.4. Technology Market
CHAPTER 4: MARKET BACKGROUND
4.1. Industry Value Chain Analysis
4.1.1. Upstream Participants
4.1.2. Downstream participants
4.2. Pricing Analysis and Forecast, 2019-2026
4.2.1. By Type
4.2.2. By Region
CHAPTER 5: RECYCLING EQUIPMENT & MACHINERY MARKET, BY MACHINE OUTLOOK
5.1. Overview
5.1.1. Market Revenue (US$ Million) and Forecast, 2019-2026
5.2. Baler Presses
5.2.1. Key Market Trends, Growth Factors and Opportunities
5.2.2. Market Revenue (US$ Million) and Forecast, By Region
5.3. Shears
5.3.1. Key Market Trends, Growth Factors and Opportunities
5.3.2. Market Revenue (US$ Million) and Forecast, By Region
5.4. Shredders
5.4.1. Key Market Trends, Growth Factors and Opportunities
5.4.2. Market Revenue (US$ Million) and Forecast, By Region
5.5. Extruders
5.5.1. Key Market Trends, Growth Factors and Opportunities
5.5.2. Market Revenue (US$ Million) and Forecast, By Region
5.6. Agglomerators
5.6.1. Key Market Trends, Growth Factors and Opportunities
5.6.2. Market Revenue (US$ Million) and Forecast, By Region
5.7. Granulators
5.7.1. Key Market Trends, Growth Factors and Opportunities
5.7.2. Market Revenue (US$ Million) and Forecast, By Region
CHAPTER 6: RECYCLING EQUIPMENT & MACHINERY MARKET BY PROCESSED MATERIALS OUTLOOK
6.1. Overview
6.1.1. Market Revenue (US$ Million) and Forecast, 2019-2026
6.2. Wood Paper & Cardboard
6.2.1. Key Market Trends, Growth Factors and Opportunities
6.2.2. Market Revenue (US$ Million) and Forecast, By Region
6.3. Plastic
6.3.1. Key Market Trends, Growth Factors and Opportunities
6.3.2. Market Revenue (US$ Million) and Forecast, By Region
6.4. Rubber
6.4.1. Key Market Trends, Growth Factors and Opportunities
6.4.2. Market Revenue (US$ Million) and Forecast, By Region
6.5. Ferrous & Non-Ferrous
6.5.1. Key Market Trends, Growth Factors and Opportunities
6.5.2. Market Revenue (US$ Million) and Forecast, By Region
CHAPTER 7: RECYCLING EQUIPMENT & MACHINERY MARKET, BY GEOGRAPHY
7.1. Overview
7.2. North America
7.2.1. Key Market Trends, Growth Factors and Opportunities
7.2.2. Market Revenue and Forecast, By Delivery Model
7.2.3. Market Revenue and Forecast, By Agriculture Type
7.2.4. Market Revenue and Forecast, By Service Provider
7.2.5. Market Revenue and Forecast, By Country
7.2.6. U.S.
7.2.6.1. Market Revenue and Forecast
7.2.7. Canada
7.2.7.1. Market Revenue and Forecast
7.2.8. Mexico
7.2.8.1. Market Revenue and Forecast
7.3. Europe
7.3.1. Market Revenue and Forecast, By Delivery Model
7.3.2. Market Revenue and Forecast, By Agriculture Type
7.3.3. Market Revenue and Forecast, By Service Provider
7.3.4. Market Revenue and Forecast, By Country
7.3.5. Germany
7.3.5.1. Market Revenue and Forecast
7.3.6. UK
7.3.6.1. Market Revenue and Forecast
7.3.7. France
7.3.7.1. Market Revenue and Forecast
7.3.8. Italy
7.3.8.1. Market Revenue and Forecast
7.3.9. Spain
7.3.9.1. Market Revenue and Forecast
7.3.10. Poland
7.3.10.1. Market Revenue and Forecast
7.3.11. Austrai
7.3.11.1. Market Revenue and Forecast
7.3.12. Luxembourg
7.3.12.1. Market Revenue and Forecast
7.3.13. Rest of Europe
7.3.13.1. Market Revenue and Forecast
7.4. Asia-Pacific
7.4.1. Market Revenue and Forecast, By Delivery Model
7.4.2. Market Revenue and Forecast, By Agriculture Type
7.4.3. Market Revenue and Forecast, By Service Provider
7.4.4. Market Revenue and Forecast, By Country
7.4.5. China
7.4.5.1. Market Revenue and Forecast
7.4.6. India
7.4.6.1. Market Revenue and Forecast
7.4.7. Japan
7.4.7.1. Market Revenue and Forecast
7.4.8. South Korea
7.4.8.1. Market Revenue and Forecast
7.4.9. Rest of APAC
7.4.9.1. Market Revenue and Forecast
7.5. REST OF THE WORLD
7.5.1. Market Revenue and Forecast, By Delivery Model
7.5.2. Market Revenue and Forecast, By Agriculture Type
7.5.3. Market Revenue and Forecast, By Service Provider
7.5.4. Market Revenue and Forecast, By Country
7.5.5. Latin America
7.5.5.1. Market Revenue and Forecast
7.5.6. Middle East
7.5.6.1. Market Revenue and Forecast
7.5.7. Africa
7.5.7.1. Market Revenue and Forecast
CHAPTER 8: COMPANY PROFILES
8.1. Airbus S.A.S
8.1.1. Company Overview
8.1.2. Financial Performance
8.1.3. SWOT Analysis
8.2. Aviation Industry Corporation of China Ltd. (AVIC)
8.2.1. Company Overview
8.2.2. Financial Performance
8.2.3. SWOT Analysis
8.3. Astronics Corporation
8.3.1. Company Overview
8.3.2. Financial Performance
8.3.3. SWOT Analysis
8.4. Boeing
8.4.1. Company Overview
8.4.2. Financial Performance
8.4.3. SWOT Analysis
8.5. Ball Corporation
8.5.1. Company Overview
8.5.2. Financial Performance
8.5.3. SWOT Analysis
8.6. BAE Systems
8.6.1. Company Overview
8.6.2. Financial Performance
8.6.3. SWOT Analysis
8.7. Cobham plc
8.7.1. Company Overview
8.7.2. Financial Performance
8.7.3. SWOT Analysis
8.8. Curtiss Wright
8.8.1. Company Overview
8.8.2. Financial Performance
8.8.3. SWOT Analysis
8.9. Elbit System
8.9.1. Company Overview
8.9.2. Financial Performance
8.9.3. SWOT Analysis
8.10. Gramin Ltd
8.10.1. Company Overview
8.10.2. Financial Performance
8.10.3. SWOT Analysis
8.11. GE Aviation
8.11.1. Company Overview
8.11.2. Financial Performance
8.11.3. SWOT Analysis
8.12. Harris Corporation
8.12.1. Company Overview
8.12.2. Financial Performance
8.12.3. SWOT Analysis
8.13. Honeywell International Inc.
8.13.1. Company Overview
8.13.2. Financial Performance
8.13.3. SWOT Analysis
8.14. Lockheed Martin Corporation
8.14.1. Company Overview
8.14.2. Financial Performance
8.14.3. SWOT Analysis
8.15. L3 Harris Corporation
8.15.1. Company Overview
8.15.2. Financial Performance
8.15.3. SWOT Analysis
8.16. Meggitt PLC
8.16.1. Company Overview
8.16.2. Financial Performance
8.16.3. SWOT Analysis
8.17. Northrop Grumman Corporation
8.17.1. Company Overview
8.17.2. Financial Performance
8.17.3. SWOT Analysis
8.18. Nucon Aerospace
8.18.1. Company Overview
8.18.2. Financial Performance
8.18.3. SWOT Analysis
8.19. Panasonic Corporation
8.19.1. Company Overview
8.19.2. Financial Performance
8.19.3. SWOT Analysis
8.20. Rolls Royce
8.20.1. Company Overview
8.20.2. Financial Performance
8.20.3. SWOT Analysis
8.21. Raytheon Company
8.21.1. Company Overview
8.21.2. Financial Performance
8.21.3. SWOT Analysis
8.22. Saab AB
8.22.1. Company Overview
8.22.2. Financial Performance
8.22.3. SWOT Analysis
8.23. Safran
8.23.1. Company Overview
8.23.2. Financial Performance
8.23.3. SWOT Analysis
8.24. Thales Group
8.24.1. Company Overview
8.24.2. Financial Performance
8.24.3. SWOT Analysis
8.25. Teledyne Technologies Inc.
8.25.1. Company Overview
8.25.2. Financial Performance
8.25.3. SWOT Analysis
8.26. Transdigm Group Inc.
8.26.1. Company Overview
8.26.2. Financial Performance
8.26.3. SWOT Analysis
PURCHASE OPTIONS
20% Free Customization ON ALL PURCHASE
*Terms & Conditions Apply
Looking for report on this market in a particular region or country? Get In Touch
Request Free Sample
Please fill in the form below to Request for free Sample Report
-
Office Hours Mon - Sat 10:00 - 16:00
-
Call Us +91 6201075429
-
Send Us Mail sales@marketdecipher.com
Market Decipher is a market research and consultancy firm involved in provision of market reports to organisations of varied sizes; small, large and medium.

© 2018 Market Decipher. All Rights Reserved