Resistant Starch Market Size, Statistics, Trend Analysis and Forecast Report, 2020 - 2027
By Source (Grains, Vegetables), By Product (RS1, RS2, RS3, RS4, RS5), By Application (Dairy Products, Bakery Products, Sugar Confections, Convenience Foods), Industry Analysis Report, Regional Outlook (U.S., Canada, Germany, UK, France, Spain, Italy, Russia, China, India, Japan, Australia, South Korea, Brazil, Mexico, Argentina, South Africa, Saudi Arabia, UAE)
- Report ID : MD1455 |
- Pages : 240 |
- Tables : 85 |
- Formats :


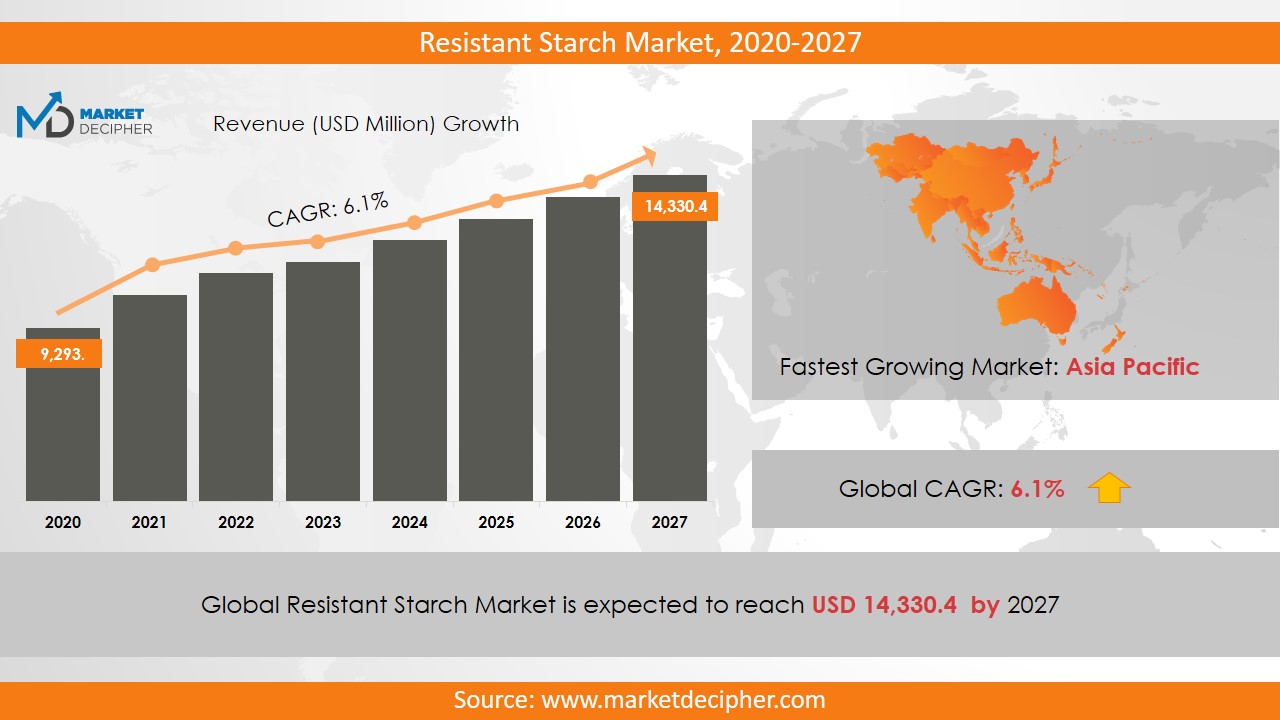
Resistant Starch Market size was estimated at $9,456.1 Million in 2019 and is expected to reach $14,312.6 Million by 2027, growing at a CAGR of 6.1% during the forecast period of 2020 to 2027.
Resistant Starch is the portion of starch which is non-digestible. Whereas regular starch is a form of carbohydrate which releases glucose, resistant starch has health benefits. Two of its biggest benefits are reduced carbohydrate levels and formation of fermenting bacteria.
Analysis by Source
Resistant Starch is categorized into three sources from where it is derived. These are Grains and Vegetables.
Grains refer to seeds characterized by their hardness and dryness. They constitute nearly half the market share by source. Grains are of two types: Legumes and Cereals. Rice, Wheat, Sorghum, Peas, Beans, and lentils are utilized for the manufacturing of resistant starch. The quality of Resistant Starch is positively affected by high amylose content.
The Resistant Starch consumption is slated for a large growth rate over the forecasted time.
Analysis by Product
Resistant Starch is segmented into five types according to product. These are Type-1, Type-2, Type-3, Type-4, and Type-5.
Of these, RS-3, also known as Type-3, holds the lion’s share of the market. Its sources tell a compelling story behind their glorified use. They are derived from Potato, Corn Flakes, Bread Crusts, and Maize. The bakery industry is its largest consumer and the rapid commercialization will continue well into the forecasted timeline.
Analysis by Application
The various applications are Dairy, Bakery, Sugar confections, and Convenience Foods.
The bakery products will have the largest demand for Resistant Starch. The acceptance and availability of Bakery foods is almost universal around the globe. It is fast becoming the food that customers want a natural, healthy, and gluten-free avatar of. To give a few examples: Cookies, Bread, Muffins, Pies, Rolls, and pastries make up the major share of these foods. Breads with resistant starch are fast gaining popularity among the masses. This is because they form an essential part of daily living of a large pool of customers.
Dairy is another sector that is likely to see an upsurge in the demand for Resistant Starch. The modern consumer is on the lookout for healthy versions of their favorite foods.
Both sugar confections and Convenience foods will also see a stable increase in product adoption. This will be in line with evolving consumer trends around the globe.
Analysis by Region
The Asia-Pacific block has a large consumption of modified starch. Special mention to China, Japan, South Korea, and Australia. It is also the venue for grain and fruit products. The middle class in these regions are experiencing an increment in disposable incomes. The advent of the internet is making consumers wary of food trends and their impact on health. Thus, Resistant Starch will largely find acceptance in this region.
North America and Europe are not too far behind. Here, patterns of consumers shifting over to products with resistant starch in them is already evident. This phenomenon will get accentuated further in the forecasted time.
Analysis by Market
Prolific industry players are MGP Ingredients, Cargill, and Tate & Lyle. Modern researchers are exploring new ways to manufacture resistant starch. Innovations such as these cost money and the organizations are funding them positively. These events unlock commercial advantages in a big way. This is evident in terms of the improved production cost. In the medium to long run, this investment will pay itself off in the face of excellent revenue that these companies will accrue.
COVERAGE HIGHLIGHTS
● Market Revenue Estimation and Forecast (2019 – 2026)
● Market Production Estimation and Forecast (2019 – 2026)
● Market Sales/Consumption Volume Estimation and Forecast (2019 – 2026)
● Breakdown of Revenue by Segments (2019 – 2026)
● Breakdown of Production by Segments (2019 – 2026)
● Breakdown of Sales Volume by Segments (2019 – 2026)
● Gross Margin and Profitability Analysis of Companies
● Business Trend and Expansion Analysis
● Import and Export Analysis
● Regional Analysis and Market Data Breakdown
MARKET SEGMENTATION
By Source Outlook ($Revenue and Unit Sales, 2019-2026)
• Grains
• Vegetables
By Product Outlook ($Revenue and Unit Sales, 2019-2026)
• RS1
• RS2
• RS3
• RS4
• RS5
By Application Outlook ($Revenue and Unit Sales, 2019-2026)
• Dairy Products
• Bakery Products
• Sugar Confections
• Convenience Foods
By Regional Outlook ($Revenue and Unit Sales, 2019-2026)
• U.S.
• Canada
• Germany
• UK
• France
• Spain
• Italy
• Russia
• China
• India
• Japan
• Australia
• South Korea
• Brazil
• Mexico
• Argentina
• South Africa
• Saudi Arabia
• UAE
Market Players
• Ingredion Incorporated
• Cargill
• MGP ingredients
• Tate & Lyle
• Arcadia Biosciences
• Stawi Foods And Fruits Limited
• Gut Garden LLC
• Natural Stacks, Inc.
• Roquette Freres
• Biome Therapeutics LLC
• Sheekharr Starch Private Limited
• MSPrebiotics Inc.
• SunOpta, Inc.
• Xian Kono Chem Co., Ltd.
CHAPTER 1: INTRODUCTION
1.1. RESEARCH METHODOLOGY
1.1.1. Desk Research
1.1.2. Data Synthesis
1.1.3. Data Validation & Market Feedback
1.1.4. Data Sources
CHAPTER 2: EXECUTIVE SUMMARY
2.1. GLOBAL MARKET OUTLOOK
2.2. CORE INSIGHTS –DELIVERY MODEL
2.3. CORE INSIGHTS – RESISTANT STARCH
2.4. CORE INSIGHTS – SERVICE PROVIDER
2.5. CORE INSIGHTS – GEOGRAPHY
CHAPTER 3: MARKET OVERVIEW
3.1. MARKET DEFINITION AND SCOPE
3.2. KEY FORCES SHAPING THE INDUSTRY
3.2.1. Bargaining Power of Suppliers
3.2.2. Bargaining Power of Buyers
3.2.3. Threat of Substitutes
3.2.4. Threat of New Entrants
3.3. MARKET DYNAMICS
3.3.1. Drivers
3.3.1.1. Supply-side Drivers
3.3.1.2. Demand-side Drivers
3.3.2. Restraints
3.3.3. Opportunities
3.4. INDUSTRY - ANALYSIS
3.4.1. Political Market
3.4.2. Environmental Market
3.4.3. Social Market
3.4.4. Technology Market
CHAPTER 4: MARKET BACKGROUND
4.1. Industry Value Chain Analysis
4.1.1. Upstream Participants
4.1.2. Downstream participants
4.2. Pricing Analysis and Forecast, 2019-2026
4.2.1. By Type
4.2.2. By Region
CHAPTER 5: RESISTANT STARCH MARKET, BY SOURCE OUTLOOK
5.1. Overview
5.1.1. Market Revenue (US$ Million) and Forecast, 2019-2026
5.2. Grains
5.2.1. Key Market Trends, Growth Factors and Opportunities
5.2.2. Market Revenue (US$ Million) and Forecast, By Region
5.3. Vegetables
5.3.1. Key Market Trends, Growth Factors and Opportunities
5.3.2. Market Revenue (US$ Million) and Forecast, By Region
CHAPTER 6: RESISTANT STARCH MARKET BY PRODUCT OUTLOOK
6.1. Overview
6.1.1. Market Revenue (US$ Million) and Forecast, 2019-2026
6.2. RS1
6.2.1. Key Market Trends, Growth Factors and Opportunities
6.2.2. Market Revenue (US$ Million) and Forecast, By Region
6.3. RS2
6.3.1. Key Market Trends, Growth Factors and Opportunities
6.3.2. Market Revenue (US$ Million) and Forecast, By Region
6.4. RS3
6.4.1. Key Market Trends, Growth Factors and Opportunities
6.4.2. Market Revenue (US$ Million) and Forecast, By Region
6.5. RS4
6.5.1. Key Market Trends, Growth Factors and Opportunities
6.5.2. Market Revenue (US$ Million) and Forecast, By Region
6.6. RS5
6.6.1. Key Market Trends, Growth Factors and Opportunities
6.6.2. Market Revenue (US$ Million) and Forecast, By Region
CHAPTER 7: RESISTANT STARCH MARKET BY APPLICATION OUTLOOK
7.1. Overview
7.1.1. Market Revenue (US$ Million) and Forecast, 2019-2026
7.2. Dairy Products
7.2.1. Key Market Trends, Growth Factors and Opportunities
7.2.2. Market Revenue (US$ Million) and Forecast, By Region
7.3. Bakery Products
7.3.1. Key Market Trends, Growth Factors and Opportunities
7.4. Sugar Confections
7.4.1. Key Market Trends, Growth Factors and Opportunities
7.4.2. Market Revenue (US$ Million) and Forecast, By Region
7.5. Convenience Foods
7.5.1. Key Market Trends, Growth Factors and Opportunities
7.5.2. Market Revenue (US$ Million) and Forecast, By Region
CHAPTER 8: RESISTANT STARCH MARKET, BY GEOGRAPHY
8.1. Overview
8.2. North America
8.2.1. Key Market Trends, Growth Factors and Opportunities
8.2.2. Market Revenue and Forecast, By Delivery Model
8.2.3. Market Revenue and Forecast, By Agriculture Type
8.2.4. Market Revenue and Forecast, By Service Provider
8.2.5. Market Revenue and Forecast, By Country
8.2.6. U.S.
8.2.6.1. Market Revenue and Forecast
8.2.7. Canada
8.2.7.1. Market Revenue and Forecast
8.2.8. Mexico
8.2.8.1. Market Revenue and Forecast
8.3. Europe
8.3.1. Market Revenue and Forecast, By Delivery Model
8.3.2. Market Revenue and Forecast, By Agriculture Type
8.3.3. Market Revenue and Forecast, By Service Provider
8.3.4. Market Revenue and Forecast, By Country
8.3.5. Germany
8.3.5.1. Market Revenue and Forecast
8.3.6. UK
8.3.6.1. Market Revenue and Forecast
8.3.7. France
8.3.7.1. Market Revenue and Forecast
8.3.8. Italy
8.3.8.1. Market Revenue and Forecast
8.3.9. Spain
8.3.9.1. Market Revenue and Forecast
8.3.10. Poland
8.3.10.1. Market Revenue and Forecast
8.3.11. Austrai
8.3.11.1. Market Revenue and Forecast
8.3.12. Luxembourg
8.3.12.1. Market Revenue and Forecast
8.3.13. Rest of Europe
8.3.13.1. Market Revenue and Forecast
8.4. Asia-Pacific
8.4.1. Market Revenue and Forecast, By Delivery Model
8.4.2. Market Revenue and Forecast, By Agriculture Type
8.4.3. Market Revenue and Forecast, By Service Provider
8.4.4. Market Revenue and Forecast, By Country
8.4.5. China
8.4.5.1. Market Revenue and Forecast
8.4.6. India
8.4.6.1. Market Revenue and Forecast
8.4.7. Japan
8.4.7.1. Market Revenue and Forecast
8.4.8. South Korea
8.4.8.1. Market Revenue and Forecast
8.4.9. Rest of APAC
8.4.9.1. Market Revenue and Forecast
8.5. REST OF THE WORLD
8.5.1. Market Revenue and Forecast, By Delivery Model
8.5.2. Market Revenue and Forecast, By Agriculture Type
8.5.3. Market Revenue and Forecast, By Service Provider
8.5.4. Market Revenue and Forecast, By Country
8.5.5. Latin America
8.5.5.1. Market Revenue and Forecast
8.5.6. Middle East
8.5.6.1. Market Revenue and Forecast
8.5.7. Africa
8.5.7.1. Market Revenue and Forecast
CHAPTER 9: COMPANY PROFILES
9.1. Airbus S.A.S
9.1.1. Company Overview
9.1.2. Financial Performance
9.1.3. SWOT Analysis
9.2. Aviation Industry Corporation of China Ltd. (AVIC)
9.2.1. Company Overview
9.2.2. Financial Performance
9.2.3. SWOT Analysis
9.3. Astronics Corporation
9.3.1. Company Overview
9.3.2. Financial Performance
9.3.3. SWOT Analysis
9.4. Boeing
9.4.1. Company Overview
9.4.2. Financial Performance
9.4.3. SWOT Analysis
9.5. Ball Corporation
9.5.1. Company Overview
9.5.2. Financial Performance
9.5.3. SWOT Analysis
9.6. BAE Systems
9.6.1. Company Overview
9.6.2. Financial Performance
9.6.3. SWOT Analysis
9.7. Cobham plc
9.7.1. Company Overview
9.7.2. Financial Performance
9.7.3. SWOT Analysis
9.8. Curtiss Wright
9.8.1. Company Overview
9.8.2. Financial Performance
9.8.3. SWOT Analysis
9.9. Elbit System
9.9.1. Company Overview
9.9.2. Financial Performance
9.9.3. SWOT Analysis
9.10. Gramin Ltd
9.10.1. Company Overview
9.10.2. Financial Performance
9.10.3. SWOT Analysis
9.11. GE Aviation
9.11.1. Company Overview
9.11.2. Financial Performance
9.11.3. SWOT Analysis
9.12. Harris Corporation
9.12.1. Company Overview
9.12.2. Financial Performance
9.12.3. SWOT Analysis
9.13. Honeywell International Inc.
9.13.1. Company Overview
9.13.2. Financial Performance
9.13.3. SWOT Analysis
9.14. Lockheed Martin Corporation
9.14.1. Company Overview
9.14.2. Financial Performance
9.14.3. SWOT Analysis
9.15. L3 Harris Corporation
9.15.1. Company Overview
9.15.2. Financial Performance
9.15.3. SWOT Analysis
9.16. Meggitt PLC
9.16.1. Company Overview
9.16.2. Financial Performance
9.16.3. SWOT Analysis
9.17. Northrop Grumman Corporation
9.17.1. Company Overview
9.17.2. Financial Performance
9.17.3. SWOT Analysis
9.18. Nucon Aerospace
9.18.1. Company Overview
9.18.2. Financial Performance
9.18.3. SWOT Analysis
9.19. Panasonic Corporation
9.19.1. Company Overview
9.19.2. Financial Performance
9.19.3. SWOT Analysis
9.20. Rolls Royce
9.20.1. Company Overview
9.20.2. Financial Performance
9.20.3. SWOT Analysis
9.21. Raytheon Company
9.21.1. Company Overview
9.21.2. Financial Performance
9.21.3. SWOT Analysis
9.22. Saab AB
9.22.1. Company Overview
9.22.2. Financial Performance
9.22.3. SWOT Analysis
9.23. Safran
9.23.1. Company Overview
9.23.2. Financial Performance
9.23.3. SWOT Analysis
9.24. Thales Group
9.24.1. Company Overview
9.24.2. Financial Performance
9.24.3. SWOT Analysis
9.25. Teledyne Technologies Inc.
9.25.1. Company Overview
9.25.2. Financial Performance
9.25.3. SWOT Analysis
9.26. Transdigm Group Inc.
9.26.1. Company Overview
9.26.2. Financial Performance
9.26.3. SWOT Analysis
PURCHASE OPTIONS
20% Free Customization ON ALL PURCHASE
*Terms & Conditions Apply
Looking for report on this market in a particular region or country? Get In Touch
Request Free Sample
Please fill in the form below to Request for free Sample Report
-
Office Hours Mon - Sat 10:00 - 16:00
-
Call Us +91 6201075429
-
Send Us Mail sales@marketdecipher.com
Market Decipher is a market research and consultancy firm involved in provision of market reports to organisations of varied sizes; small, large and medium.

© 2018 Market Decipher. All Rights Reserved