Semiconductor Intellectual Property Market Revenue & Trend Forecasts Report, 2018-2025
By Type (Verification IP, Memory IP, Interface IP, ASIS and Processor IP), By Architecture Design (Soft IP and Hard IP), By Application (Telecommunications, Healthcare, Automotive, Consumer electronics, and others), By Region (North America, Europe, APAC and Rest of the World))
- Report ID : MD1131 |
- Pages : 198 |
- Tables : 86 |
- Formats :


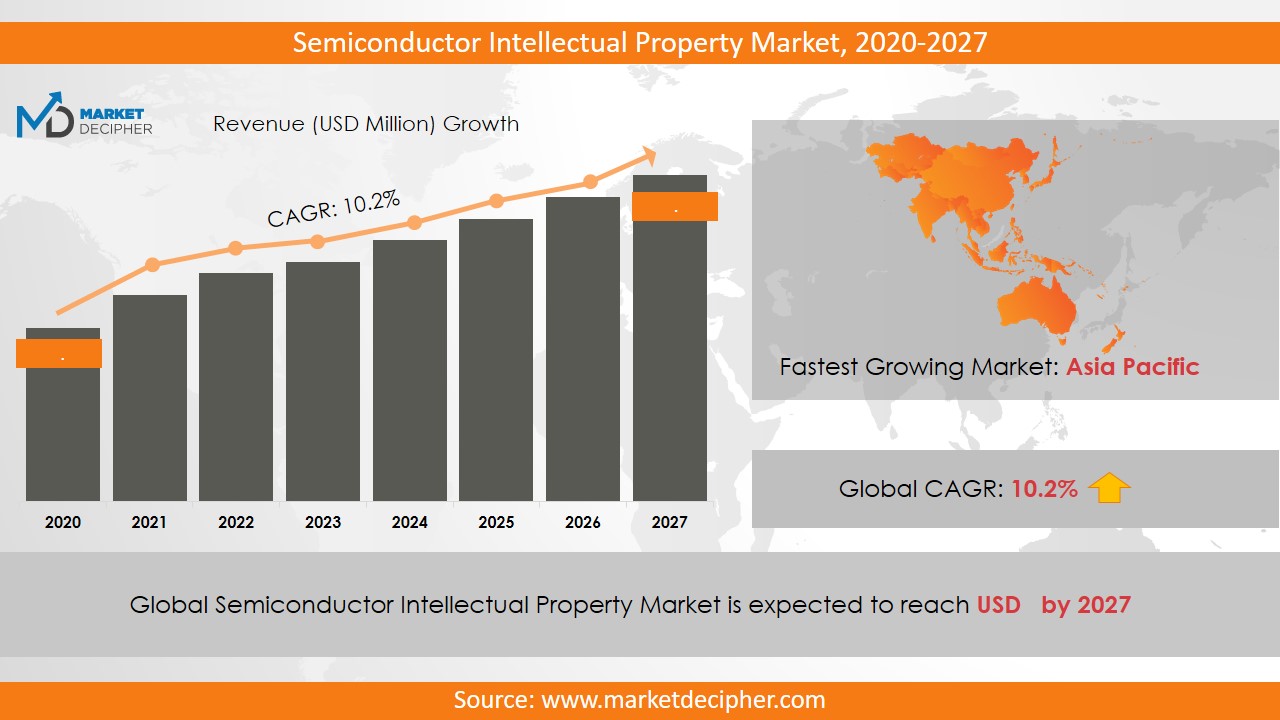
Semiconductor Intellectual Property market revenue shall reach a value of $XX Million in 2026, growing with a CAGR of XX.X% during the forecast period of 2019 to 2026. In terms of volume sales, the market is anticipated to reach XX Units.
This technology is quite useful in various sectors where there is a need for designing models or illustrations. Enhanced designing efficiency by the use of this technology is the major factor in increasing the semiconductor intellectual property market sales. Moreover, the affordable cost for implementation of this technology is propelling the overall revenue at a very fast rate. Increasing costs of design and increasing market pressure have forced companies to search for semiconductor IP manufacturers. The leading drivers of the semiconductor intellectual property market shares are high adoption of advanced technology, significantly increasing demand of the electronic devices along with the increasing demand for new SOC designs. The growing demand for various consumer electronics appliances like smartphones, laptops, and tablets is anticipated to contribute to the development of the market.
This technology locates its wide application in various sectors such as telecommunications, consumer electronics, healthcare automotive and others. Further, the increasing awareness among consumers and the ongoing innovative activities and advancements in the development sectors is anticipated to expand the semiconductor intellectual property market size during the forecast period. Moreover, the improvements in several technologies such as programmable and embedded DSP IP will further influence semiconductor intellectual property market trends positively.
REGIONAL ANALYSIS
The Asia Pacific region is the dominant region in contributing to the market growth in 2018. The rising number of electronic devices users are driving the revenue of the market in the region. Further, the increasing trend of using smartphones coupled with internet services is increasing the semiconductor intellectual property market shares in this region. Moreover, the North American region is also anticipated to grow significantly over the forecast period owing to the heavy competition among the industry players in these regions.
SEGMENT ANALYSIS
Based on type, the semiconductor intellectual property market report provides a detailed analysis of verification IP, memory IP, interface IP, ASIS and processor IP. By architecture, the segmentation has been done as a soft IP and hard IP. Out of which, the soft IP segment has emerged as the dominant segment in terms of revenue in recent years. By application, the bifurcation has been done as telecommunications, healthcare, automotive, consumer electronics and others. The automotive has dominated the overall revenue in 2018 and is anticipated to continue the same trend over the forecast period.
INDUSTRY PLAYER ANALYSIS
Major industry players have been analyzed with coverage on their operating areas, revenues, and other strategic aspects. These industry players include Altera, Arm Limited, Cast Incorporated, Ceva Incorporated, Cadence Design Systems Incorporated, eSilicon Corporation, Imagination Technologies Limited, Siemens Business, Open-Silicon Incorporated, Kilopass Technology Incorporated, Mentor, Silabtech Private Limited, Avery, and Synopsys Incorporated. Moreover, the rising number of industry players investing in developing countries is playing a vital role in increasing the overall revenue.
COVERAGE HIGHLIGHTS
• Revenue Estimation and Forecast (2018 – 2026)
• Production Estimation and Forecast (2018 – 2026)
• Sales/Consumption Volume Estimation and Forecast (2018 – 2026)
• Breakdown of Revenue by Segments (2018 – 2026)
• Breakdown of Production by Segments (2018 – 2026)
• Breakdown of Sales Volume by Segments (2018 – 2026)
• Gross Margin and Profitability Analysis of Companies
• Business Trend and Expansion Analysis
• Import and Export Analysis
• Regional Analysis and Data Breakdown
SEGMENTAL ANALYSIS
By Type Outlook ($Revenue, 2018-2026)
· Verification IP
· Memory IP
· Interface IP
· ASIC
· Processor IP
By Architecture Design Outlook ($Revenue, 2018-2026)
· Soft IP
· Hard IP
By Application Outlook ($Revenue, 2018-2026)
• Telecommunications
• Healthcare
• Automotive
• Consumer electronics
• Others
By Regional Outlook ($Revenue and Unit Sales, 2018-2026)
• North America
• Canada
• U.S
• Mexico
• Europe
• Germany
• U.K
• France
• Netherlands
• Austria
• Rest of Europe
• Asia-Pacific
• China
• India
• Japan
• South Korea
• Australia
• Rest of Asia Pacific
• The Middle East and Africa
• Saudi Arabia
• United Arab Emirates
• Rest of Middle East
• Africa
• South America
• Brazil
• Argentina
• Rest of South America
INDUSTRY PLAYERS ANALYSIS:
· Altera
· Arm Limited
· Cast Incorporated
· Ceva Incorporated
· Cadence Design Systems Incorporated
· eSilicon Corporation
· Imagination Technologies Limited
· Siemens Business
· Open-Silicon Incorporated
· Kilopass Technology Incorporated
· Mentor
· Silabtech Private Limited
· Avery
· Synopsys Incorporated
CHAPTER 1. INTRODUCTION
1.1. RESEARCH METHODOLOGY
1.1.1. Data Collection
1.1.2. Data Modeling
1.1.3. Historical Revenue and Sales Estimation
1.1.4. Data Triangulation
1.2. RESEARCH PROCESS
1.2.1. Primary Research
1.2.2. Secondary Research
1.2.3. Survey Data
1.2.4. Validation by In-House Expert
1.3. SEMICONDUCTOR INTELLECTUAL PROPERTY MARKET OVERVIEW
1.3.1. Research Scope and Market Definition
1.3.2. Executive Summary
CHAPTER 2. GLOBAL SEMICONDUCTOR INTELLECTUAL PROPERTY MARKET DEMAND SIDE ANALYSIS
2.1. SEMICONDUCTOR INTELLECTUAL PROPERTY MARKET CONSUMPTION VOLUME (MILLION UNITS), 2018 – 2025
2.2. MARKET CONSUMPTION VOLUME SPLIT BY REGION (MILLION UNITS), 2018 – 2025
2.3. MARKET CONSUMPTION VOLUME SPLIT BY COUNTRIES (MILLION UNITS), 2018 – 2025
2.4. MARKET REVENUE (MILLION USD), 2018-2025
2.5. MARKET REVENUE SPLIT BY REGION (MILLION UNITS), 2018 – 2025
2.6. SEMICONDUCTOR INTELLECTUAL PROPERTY MARKET REVENUE SPLIT BY COUNTRIES (MILLION UNITS), 2018 – 2025
CHAPTER 3. GLOBAL SEMICONDUCTOR INTELLECTUAL PROPERTY MARKET SUPPLY SIDE ANALYSIS
3.1. SEMICONDUCTOR INTELLECTUAL PROPERTY MARKET PRODUCTION VOLUME (MILLION UNITS), 2018 – 2025
3.2. MARKET PRODUCTION VOLUME SPLIT BY REGION (MILLION UNITS), 2018-2025
3.3. MARKET PRODUCTION VOLUME SPLIT/RANKING BY COUNTRIES (MILLION UNITS), 2018 – 2025
CHAPTER 4. GLOBAL SEMICONDUCTOR INTELLECTUAL PROPERTY MARKET COMPETITIVE SCENARIO & BUSINESS OPPORTUNITY ANALYSIS
4.1. COMPETITIVE STRENGTH RANKING BY MAJOR COUNTRIES, 2018
4.2. MARKET ATTRACTIVENESS RANKING BY MAJOR COUNTRIES, 2018 - 2025
4.3. EMERGING BUSINESS OPPORTUNITIES AND GROWTH PROSPECTS
4.3.1. Growth Drivers
4.3.2. Market Restraints
4.3.2. Opportunities
CHAPTER 5. GLOBAL SEMICONDUCTOR INTELLECTUAL PROPERTY MARKET ENTRY STRATEGIES
5.1. ENTRY STRATEGIES IN DEVELOPING MARKETS
5.2. ENTRY STRATEGIES IN DEVELOPED MARKETS
CHAPTER 6. GLOBAL SEMICONDUCTOR INTELLECTUAL PROPERTY MARKET BY TYPE
6.1. SEGMENT OUTLINE
6.2. REVENUE SHARE BY TYPE, $MILLION, 2018 – 2025
6.2. CONSUMPTION SHARE BY TYPE, MILLION UNITS, 2018 - 2025
6.3. PRODUCTION SHARE BY TYPE, MILLION UNITS, 2018 – 2025
6.4. VERIFICATION IP
6.4.1. Market determinants and trend analysis
6.4.2. Market revenue, sales and production volume, 2018 – 2025
6.5. MEMORY IP
6.5.1. Market determinants and trend analysis
6.5.2. Market revenue, sales and production volume, 2018 – 2025
6.6. INTERFACE IP
6.6.1. Market determinants and trend analysis
6.6.2. Market revenue, sales and production volume, 2018 – 2025
6.7. ASIC
6.7.1. Market determinants and trend analysis
6.7.2. Market revenue, sales and production volume, 2018 – 2025
6.8. PROCESSOR IP
6.8.1. Market determinants and trend analysis
6.8.2. Market revenue, sales and production volume, 2018 – 2025
CHAPTER 7. GLOBAL SEMICONDUCTOR INTELLECTUAL PROPERTY MARKET BY ARCHITECTURE DESIGN
7.1. SEGMENT OUTLINE
7.2. REVENUE SHARE BY ARCHITECTURE DESIGN, $MILLION, 2018 – 2025
7.2. CONSUMPTION SHARE BY ARCHITECTURE DESIGN, MILLION UNITS, 2018 - 2025
7.3. PRODUCTION SHARE BY ARCHITECTURE DESIGN, MILLION UNITS, 2018 – 2025
7.4. SOFT IP
7.4.1. Market determinants and trend analysis
7.4.2. Market revenue, sales and production volume, 2018 – 2025
7.5. HARD IP
7.5.1. Market determinants and trend analysis
7.5.2. Market revenue, sales and production volume, 2018 – 2025
CHAPTER 8. GLOBAL SEMICONDUCTOR INTELLECTUAL PROPERTY MARKET BY APPLICATION
8.1. SEGMENT OUTLINE
8.2. REVENUE SHARE BY APPLICATION, $MILLION, 2018 – 2025
8.2. CONSUMPTION SHARE BY APPLICATION, MILLION UNITS, 2018 - 2025
8.3. PRODUCTION SHARE BY APPLICATION, MILLION UNITS, 2018 – 2025
8.4. TELECOMMUNICATIONS
8.4.1. Market determinants and trend analysis
8.4.2. Market revenue, sales and production volume, 2018 – 2025
8.5. HEALTHCARE
8.5.1. Market determinants and trend analysis
8.5.2. Market revenue, sales and production volume, 2018 – 2025
8.6. AUTOMOTIVE
8.6.1. Market determinants and trend analysis
8.6.2. Market revenue, sales and production volume, 2018 – 2025
8.7. CONSUMER ELECTRONICS
8.7.1. Market determinants and trend analysis
8.7.2. Market revenue, sales and production volume, 2018 – 2025
8.8. OTHERS
8.8.1. Market determinants and trend analysis
8.8.2. Market revenue, sales and production volume, 2018 – 2025
CHAPTER 9. GLOBAL SEMICONDUCTOR INTELLECTUAL PROPERTY MARKET BY REGIONS
9.1. REGIONAL OUTLOOK
9.2. MARKET PRODUCTION, CONSUMPTION & REVENUE BY REGION, 2018-2025
9.3. NORTH AMERICA
9.3.1. Current Trends and Future Prospects
9.3.2. North America market revenue, sales and production volume, 2018 – 2025
9.3.3. The U.S.
9.3.3.1. Semiconductor Intellectual Property Market Revenue $Million (2018 – 2025)
9.3.3.2. Semiconductor Intellectual Property Market Consumption Million Units (2018 – 2025)
9.3.3.3. Semiconductor Intellectual Property Market Production Million Units (2018 – 2025)
9.3.4. Canada
9.3.4.1. Semiconductor Intellectual Property Market Revenue $Million (2018 – 2025)
9.3.4.2. Semiconductor Intellectual Property Market Consumption Million Units (2018 – 2025)
9.3.4.3. Semiconductor Intellectual Property Market Production Million Units (2018 – 2025)
9.3.5. Mexico
9.3.5.1. Semiconductor Intellectual Property Market Revenue $Million (2018 – 2025)
9.3.5.2. Semiconductor Intellectual Property Market Consumption Million Units (2018 – 2025)
9.3.5.3. Semiconductor Intellectual Property Market Production Million Units (2018 – 2025)
9.4. EUROPE
9.4.1. Current Trends and Future Prospects
9.4.2. Europe market revenue, sales and production volume, 2018 – 2025
9.4.3. U.K
9.4.3.1. Semiconductor Intellectual Property Market Revenue $Million (2018 – 2025)
9.4.3.2. Semiconductor Intellectual Property Market Consumption Million Units (2018 – 2025)
9.4.3.3. Semiconductor Intellectual Property Market Production Million Units (2018 – 2025)
9.4.4. Germany
9.4.4.1. Semiconductor Intellectual Property Market Revenue $Million (2018 – 2025)
9.4.4.2. Semiconductor Intellectual Property Market Consumption Million Units (2018 – 2025)
9.4.4.3. Semiconductor Intellectual Property Market Production Million Units (2018 – 2025)
9.4.5. France
9.4.5.1. Semiconductor Intellectual Property Market Revenue $Million (2018 – 2025)
9.4.5.2. Semiconductor Intellectual Property Market Consumption Million Units (2018 – 2025)
9.4.5.3. Semiconductor Intellectual Property Market Production Million Units (2018 – 2025)
9.4.6. Italy
9.4.6.1. Semiconductor Intellectual Property Market Revenue $Million (2018 – 2025)
9.4.6.2. Semiconductor Intellectual Property Market Consumption Million Units (2018 – 2025)
9.4.6.3. Semiconductor Intellectual Property Market Production Million Units (2018 – 2025)
9.4.7. Rest of Europe
9.4.7.1. Semiconductor Intellectual Property Market Revenue $Million (2018 – 2025)
9.4.7.2. Semiconductor Intellectual Property Market Consumption Million Units (2018 – 2025)
9.4.7.3. Semiconductor Intellectual Property Market Production Million Units (2018 – 2025)
9.5. ASIA PACIFIC
9.5.1. Current Trends and Future Prospects
9.5.2. Europe market revenue, sales and production volume, 2018 – 2025
9.5.3. India
9.5.3.1. Semiconductor Intellectual Property Market Revenue $Million (2018 – 2025)
9.5.3.2. Semiconductor Intellectual Property Market Consumption Million Units (2018 – 2025)
9.5.3.3. Semiconductor Intellectual Property Market Production Million Units (2018 – 2025)
9.5.4. Japan
9.5.4.1. Semiconductor Intellectual Property Market Revenue $Million (2018 – 2025)
9.5.4.2. Semiconductor Intellectual Property Market Consumption Million Units (2018 – 2025)
9.5.4.3. Semiconductor Intellectual Property Market Production Million Units (2018 – 2025)
9.5.5. China
9.5.5.1. Semiconductor Intellectual Property Market Revenue $Million (2018 – 2025)
9.5.5.2. Semiconductor Intellectual Property Market Consumption Million Units (2018 – 2025)
9.5.5.3. Semiconductor Intellectual Property Market Production Million Units (2018 – 2025)
9.5.6. South Korea
9.5.6.1. Semiconductor Intellectual Property Market Revenue $Million (2018 – 2025)
9.5.6.2. Semiconductor Intellectual Property Market Consumption Million Units (2018 – 2025)
9.5.6.3. Semiconductor Intellectual Property Market Production Million Units (2018 – 2025)
9.5.7. Rest of APAC
9.5.7.1. Semiconductor Intellectual Property Market Revenue $Million (2018 – 2025)
9.5.7.2. Semiconductor Intellectual Property Market Consumption Million Units (2018 – 2025)
9.5.7.3. Semiconductor Intellectual Property Market Production Million Units (2018 – 2025)
9.6. REST OF THE WORLD
9.6.1. Current Trends and Future Prospects
9.6.2. Europe market revenue, sales and production volume, 2018 – 2025
9.6.3. Latin America
9.6.3.1. Semiconductor Intellectual Property Market Revenue $Million (2018 – 2025)
9.6.3.2. Semiconductor Intellectual Property Market Consumption Million Units (2018 – 2025)
9.6.3.3. Semiconductor Intellectual Property Market Production Million Units (2018 – 2025)
9.6.4. Middle East
9.6.4.1. Semiconductor Intellectual Property Market Revenue $Million (2018 – 2025)
9.6.4.2. Semiconductor Intellectual Property Market Consumption Million Units (2018 – 2025)
9.6.4.3. Semiconductor Intellectual Property Market Production Million Units (2018 – 2025)
9.6.5. Africa
9.6.5.1. Semiconductor Intellectual Property Market Revenue $Million (2018 – 2025)
9.6.5.2. Semiconductor Intellectual Property Market Consumption Million Units (2018 – 2025)
9.6.5.3. Semiconductor Intellectual Property Market Production Million Units (2018 – 2025)
CHAPTER 10. KEY VENDOR PROFILES
10.1. Altera
10.1.1. Company overview
10.1.2. Portfolio Analysis
10.1.3. Estimated revenue from semiconductor intellectual property business and market share
10.1.4. Regional & business segment Revenue Analysis
10.2. Arm Limited
10.2.1. Company overview
10.2.2. Portfolio Analysis
10.2.3. Estimated revenue from semiconductor intellectual property business and market share
10.2.4. Regional & business segment Revenue Analysis
10.3. Cast Incorporated
10.3.1. Company overview
10.3.2. Portfolio Analysis
10.3.3. Estimated revenue from semiconductor intellectual property business and market share
10.3.4. Regional & business segment Revenue Analysis
10.4. Ceva Incorporated
10.4.1. Company overview
10.4.2. Portfolio Analysis
10.4.3. Estimated revenue from semiconductor intellectual property business and market share
10.4.4. Regional & business segment Revenue Analysis
10.5. Cadence Design Systems Incorporated
10.5.1. Company overview
10.5.2. Portfolio Analysis
10.5.3. Estimated revenue from semiconductor intellectual property business and market share
10.5.4. Regional & business segment Revenue Analysis
10.6. eSilicon Corporation
10.6.1. Company overview
10.6.2. Portfolio Analysis
10.6.3. Estimated revenue from semiconductor intellectual property business and market share
10.6.4. Regional & business segment Revenue Analysis
10.7. Imagination Technologies Limited
10.7.1. Company overview
10.7.2. Portfolio Analysis
10.7.3. Estimated revenue from semiconductor intellectual property business and market share
10.7.4. Regional & business segment Revenue Analysis
10.8. Siemens Business
10.8.1. Company overview
10.8.2. Portfolio Analysis
10.8.3. Estimated revenue from semiconductor intellectual property business and market share
10.8.4. Regional & business segment Revenue Analysis
10.9. Open-Silicon Incorporated
10.9.1. Company overview
10.9.2. Portfolio Analysis
10.9.3. Estimated revenue from semiconductor intellectual property business and market share
10.9.4. Regional & business segment Revenue Analysis
10.10. Kilopass Technology Incorporated
10.10.1. Company overview
10.10.2. Portfolio Analysis
10.10.3. Estimated revenue from semiconductor intellectual property business and market share
10.10.4. Regional & business segment Revenue Analysis
10.11. Mentor
10.11.1. Company overview
10.11.2. Portfolio Analysis
10.11.3. Estimated revenue from semiconductor intellectual property business and market share
10.11.4. Regional & business segment Revenue Analysis
10.12. Silabtech Private Limited
10.12.1. Company overview
10.12.2. Portfolio Analysis
10.12.3. Estimated revenue from semiconductor intellectual property business and market share
10.12.4. Regional & business segment Revenue Analysis
10.13. Avery
10.13.1. Company overview
10.13.2. Portfolio Analysis
10.13.3. Estimated revenue from semiconductor intellectual property business and market share
10.13.4. Regional & business segment Revenue Analysis
10.14. Synopsys Incorporated
10.14.1. Company overview
10.14.2. Portfolio Analysis
10.14.3. Estimated revenue from semiconductor intellectual property business and market share
10.14.4. Regional & business segment Revenue Analysis
PURCHASE OPTIONS
20% Free Customization ON ALL PURCHASE
*Terms & Conditions Apply
Looking for report on this market in a particular region or country? Get In Touch
Request Free Sample
Please fill in the form below to Request for free Sample Report
-
Office Hours Mon - Sat 10:00 - 16:00
-
Call Us +91 6201075429
-
Send Us Mail sales@marketdecipher.com
Market Decipher is a market research and consultancy firm involved in provision of market reports to organisations of varied sizes; small, large and medium.

© 2018 Market Decipher. All Rights Reserved