Smart Materials Market Revenue, Sales Volume & Trend Forecasts Report, 2019-2026
By Product Type (Piezo-electric materials, Biomimetic materials, Thermally responsive materials, Magnetostrictive materials, Halo-chromic materials, Smart hydrogels, Shape memory materials and Smart fluids), By Application (Sensors, Structural materials, Mechanical structures, Transducers, Energy harvesting devices, Actuators and Motors), By End-User Industry (Agriculture and Food, Leisure and sports, Healthcare, Construction, and Infrastructure, Transportation), By Region (North America, Europe, APAC and Rest of the World)
- Report ID : MD1046 |
- Pages : 96 |
- Tables : 84 |
- Formats :


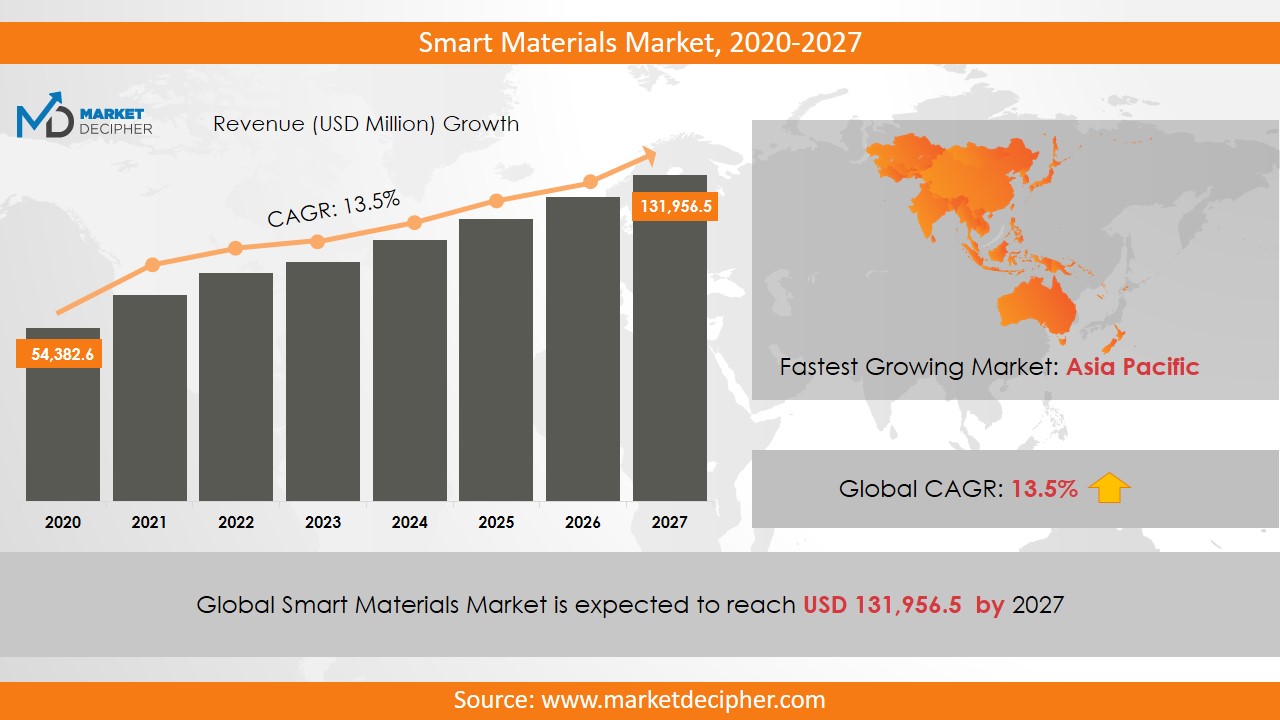
Smart Materials market revenue shall reach a value of $112.34 Billion in 2026, growing with a CAGR of 17.23% during the forecast period of 2018 to 2026. While In terms of volume sales, the market is anticipated to reach XX Units.
The wide use of motors and actuators, structural materials and sensors are anticipated to support the smart material market growth substantially over time. These products retain their original state after the removal of stimuli and are not only dynamic but also have minimum responding time. Further, the rapid development of the manufacturing industries and increasing adoption of the advanced materials to achieve high and efficient performance, are paying a major role in propelling the smart materials market sales significantly. Also, its low cost of maintenance is anticipated to drive revenue commendably over the forecast period.
The smart materials industry is expected to grow at the fastest rate over the forecast period due to the increasing use of piezoelectric devices. However, the challenges in various research and development activities are anticipated to hamper the growth of the smart materials market shares shortly. The increasing application of the smart material products in various fields such as mechanical structures, transducers, sensors, and energy harvesting devices are going to boost up the market sales tremendously over time.
REGIONAL ANALYSIS
The North American region has contributed substantially in 2018 owing to the increasing investment in the industry by several companies such as consumer goods, automotive, and aerospace as there is a high demand for motors and actuators in the region. The Asia Pacific region is anticipated to fuel up the market growth over the forecast period as the research activities are taking place in the region at a significant rate.
SEGMENT ANALYSIS
In terms of product type, the segmentation has been done as Piezo-electric materials, biomimetic materials, thermally responsive materials, magnetostrictive materials, Halochromic materials, and shape memory materials. Based on the application, the smart materials market report provides a keen analysis of sensors, structural materials, mechanical structures, transducers, energy harvesting devices, actuators, and motors. Out of which, the actuators segment has shown its dominance in recent years.
In terms of end-user industries, the market has been segmented as Agriculture and food, leisure and sports, healthcare, construction and infrastructure, transportation. Nowadays, loudspeakers are used in the form of acoustic actuators specifically for active noise control applications. Actuators are also heavily used in the automotive sector because they help to improve the performance of a vehicle. Inactivation technology, shape-memory alloys are used for tight-integration. Thus, the automotive segment is making huge investments in this market.
INDUSTRY PLAYER ANALYSIS:
Major industry players have been analyzed with emphasis on their operating areas, revenues, and other strategic aspects. These industry players include Advanced Cerametrics Incorporated, Channel Technologies Group LLC, Ceram Tech GmbH, APC International Limited, Wright Medical Group Incorporated, Kyocera Corporation, CTS Corporation, NO LIC A/S, TDK Corporation and LORD Corporation. Other industries in this domain that are growing at a high CAGR include CMOS Smartphone Camera Lens Market and Smart Waste Collection Market.
COVERAGE HIGHLIGHTS
• Revenue Estimation and Forecast (2018 – 2026)
• Production Estimation and Forecast (2018 – 2026)
• Sales/Consumption Volume Estimation and Forecast (2018 – 2026)
• Breakdown of Revenue by Segments (2018 – 2026)
• Breakdown of Production by Segments (2018 – 2026)
• Breakdown of Sales Volume by Segments (2018 – 2026)
• Gross Margin and Profitability Analysis of Companies
• Business Trend and Expansion Analysis
• Import and Export Analysis
• Regional Analysis and Data Breakdown
SEGMENTAL ANALYSIS:
By Product Outlook ($Revenue and Unit Sales, 2018-2026)
· Piezo-electric materials
· Biomimetic materials
· Thermally responsive materials
· Magnetostrictive materials
· Halochromic materials
· Shape memory materials
By Application Outlook ($Revenue and Unit Sales, 2018-2026)
· Sensors
· Structural materials
· Mechanical structures
· Transducers
· Energy harvesting devices
· Actuators and motors
By End-User Industry Outlook ($Revenue and Unit Sales, 2018-2026)
· Agriculture and food
· Leisure and sports
· Healthcare
· Construction and infrastructure
· Transportation
By Regional Outlook ($Revenue and Unit Sales, 2018-2026)
• North America
• Canada
• U.S
• Mexico
• Europe
• Germany
• France
• U.K
• Rest of Europe
• Asia-Pacific
• China
• India
• Japan
• Rest of Asia Pacific
• Rest of the World
• Middle East
• Africa
• Latin America
INDUSTRY PLAYER ANALYSIS:
• Advanced Cerametrics Incorporated
• Channel Technologies Group LLC
• Ceram Tech GmbH
• APC International Limited
• Wright Medical Group Incorporated
• Kyocera Corporation
• CTS Corporation
• NO LIC A/S
• TDK Corporation
• LORD Corporation
CHAPTER 1. INTRODUCTION
1.1. RESEARCH METHODOLOGY
1.1.1. Data Collection
1.1.2. Data Modeling
1.1.3. Historical Revenue and Sales Estimation
1.1.4. Data Triangulation
1.2. RESEARCH PROCESS
1.2.1. Primary Research
1.2.2. Secondary Research
1.2.3. Survey Data
1.2.4. Validation by In-House Expert
1.3. SMART MATERIALS MARKET OVERVIEW
1.3.1. Research Scope and Market Definition
1.3.2. Executive Summary
CHAPTER 2. GLOBAL SMART MATERIALS MARKET DEMAND SIDE ANALYSIS
2.1. SMART MATERIALS MARKET CONSUMPTION VOLUME (BILLION UNITS), 2018 – 2025
2.2. MARKET CONSUMPTION VOLUME SPLIT BY REGION (BILLION UNITS), 2018 – 2025
2.3. MARKET CONSUMPTION VOLUME SPLIT BY COUNTRIES (BILLION UNITS), 2018 – 2025
2.4. MARKET REVENUE (BILLION USD), 2018-2025
2.5. MARKET REVENUE SPLIT BY REGION (BILLION UNITS), 2018 – 2025
2.6. SMART MATERIALS MARKET REVENUE SPLIT BY COUNTRIES (BILLION UNITS), 2018 – 2025
CHAPTER 3. GLOBAL SMART MATERIALS MARKET SUPPLY SIDE ANALYSIS
3.1. SMART MATERIALS MARKET PRODUCTION VOLUME (BILLION UNITS), 2018 – 2025
3.2. MARKET PRODUCTION VOLUME SPLIT BY REGION (BILLION UNITS), 2018-2025
3.3. MARKET PRODUCTION VOLUME SPLIT/RANKING BY COUNTRIES (BILLION UNITS), 2018 – 2025
CHAPTER 4. GLOBAL SMART MATERIALS MARKET COMPETITIVE SCENARIO & BUSINESS OPPORTUNITY ANALYSIS
4.1. COMPETITIVE STRENGTH RANKING BY MAJOR COUNTRIES, 2018
4.2. MARKET ATTRACTIVENESS RANKING BY MAJOR COUNTRIES, 2018 - 2025
4.3. EMERGING BUSINESS OPPORTUNITIES AND GROWTH PROSPECTS
4.3.1. Growth Drivers
4.3.2. Market Restraints
4.3.2. Opportunities
CHAPTER 5. GLOBAL SMART MATERIALS MARKET ENTRY STRATEGIES
5.1. ENTRY STRATEGIES IN DEVELOPING MARKETS
5.2. ENTRY STRATEGIES IN DEVELOPED MARKETS
CHAPTER 6. GLOBAL SMART MATERIALS MARKET BY PRODUCT
6.1. SEGMENT OUTLINE
6.2. REVENUE SHARE BY PRODUCT, $BILLION, 2018 – 2025
6.2. CONSUMPTION SHARE BY PRODUCT, BILLION UNITS, 2018 - 2025
6.3. PRODUCTION SHARE BY PRODUCT, BILLION UNITS, 2018 – 2025
6.4. PIEZO-ELECTRIC MATERIALS
6.4.1. Market determinants and trend analysis
6.4.2. Market revenue, sales and production volume, 2018 – 2025
6.5. BIOMIMETIC MATERIALS
6.5.1. Market determinants and trend analysis
6.5.2. Market revenue, sales and production volume, 2018 – 2025
6.6. THERMALLY RESPONSIVE MATERIALS
6.6.1. Market determinants and trend analysis
6.6.2. Market revenue, sales and production volume, 2018 – 2025
6.7. MAGNETOSTRICTIVE MATERIALS
6.7.1. Market determinants and trend analysis
6.7.2. Market revenue, sales and production volume, 2018 – 2025
6.8. HALOCHROMIC MATERIALS
6.8.1. Market determinants and trend analysis
6.8.2. Market revenue, sales and production volume, 2018 – 2025
6.9. SMART HYDROGELS
6.9.1. Market determinants and trend analysis
6.9.2. Market revenue, sales and production volume, 2018 – 2025
6.10. SHAPE MEMORY MATERIALS
6.9.1. Market determinants and trend analysis
6.9.2. Market revenue, sales and production volume, 2018 – 2025
6.11. SMART FLUIDS
6.9.1. Market determinants and trend analysis
6.9.2. Market revenue, sales and production volume, 2018 – 2025
CHAPTER 7. GLOBAL SMART MATERIALS MARKET BY APPLICATION
7.1. SEGMENT OUTLINE
7.2. REVENUE SHARE BY APPLICATION, $BILLION, 2018 – 2025
7.2. CONSUMPTION SHARE BY SEG APPLICATION MENTB, BILLION UNITS, 2018 - 2025
7.3. PRODUCTION SHARE BY APPLICATION, BILLION UNITS, 2018 – 2025
7.4. SENSORS
7.4.1. Market determinants and trend analysis
7.4.2. Market revenue, sales and production volume, 2018 – 2025
7.5. STRUCTURAL MATERIALS
7.5.1. Market determinants and trend analysis
7.5.2. Market revenue, sales and production volume, 2018 – 2025
7.6. MECHANICAL STRUCTURES
7.6.1. Market determinants and trend analysis
7.6.2. Market revenue, sales and production volume, 2018 – 2025
7.7. TRANSDUCERS
7.7.1. Market determinants and trend analysis
7.7.2. Market revenue, sales and production volume, 2018 – 2025
7.8. ENERGY HARVESTING DEVICES
7.8.1. Market determinants and trend analysis
7.8.2. Market revenue, sales and production volume, 2018 – 2025
7.9. ACTUATORS AND MOTORS
7.9.1. Market determinants and trend analysis
7.9.2. Market revenue, sales and production volume, 2018 – 2025
7.12.2. Market revenue, sales and production volume, 2018 – 2025
CHAPTER 8. GLOBAL SMART MATERIALS MARKET BY END-USER
8.1. SEGMENT OUTLINE
8.2. REVENUE SHARE BY END-USER, $BILLION, 2018 – 2025
8.2. CONSUMPTION SHARE BY END-USER, BILLION UNITS, 2018 - 2025
8.3. PRODUCTION SHARE BY END-USER, BILLION UNITS, 2018 – 2025
8.4. AGRICULTURE AND FOOD
8.4.1. Market determinants and trend analysis
8.4.2. Market revenue, sales and production volume, 2018 – 2025
8.5. LEISURE AND SPORTS
8.5.1. Market determinants and trend analysis
8.5.2. Market revenue, sales and production volume, 2018 – 2025
8.6. HEALTHCARE
8.6.1. Market determinants and trend analysis
8.6.2. Market revenue, sales and production volume, 2018 – 2025
8.7. CONSTRUCTION AND INFRASTRUCTURE
8.7.1. Market determinants and trend analysis
8.7.2. Market revenue, sales and production volume, 2018 – 2025
8.8. TRANSPORTATION
8.8.1. Market determinants and trend analysis
8.8.2. Market revenue, sales and production volume, 2018 – 2025
CHAPTER 9. GLOBAL SMART MATERIALS MARKET BY REGIONS
9.1. REGIONAL OUTLOOK
9.2. MARKET PRODUCTION, CONSUMPTION & REVENUE BY REGION, 2018-2025
9.3. NORTH AMERICA
9.3.1. Current Trends and Future Prospects
9.3.2. North America market revenue, sales and production volume, 2018 – 2025
9.3.3. U.S.
9.3.3.1. Smart Materials Market Revenue $BILLION (2018 – 2025)
9.3.3.2. Smart Materials Market Consumption BILLION Units (2018 – 2025)
9.3.3.3. Smart Materials Market Production BILLION Units (2018 – 2025)
9.3.4. Canada
9.3.4.1. Smart Materials Market Revenue $BILLION (2018 – 2025)
9.3.4.2. Smart Materials Market Consumption BILLION Units (2018 – 2025)
9.3.4.3. Smart Materials Market Production BILLION Units (2018 – 2025)
9.3.5. Mexico
9.3.5.1. Smart Materials Market Revenue $BILLION (2018 – 2025)
9.3.5.2. Smart Materials Market Consumption BILLION Units (2018 – 2025)
9.3.5.3. Smart Materials Market Production BILLION Units (2018 – 2025)
9.4. EUROPE
9.4.1. Current Trends and Future Prospects
9.4.2. Europe market revenue, sales and production volume, 2018 – 2025
9.4.3. U.K
9.4.3.1. Smart Materials Market Revenue $BILLION (2018 – 2025)
9.4.3.2. Smart Materials Market Consumption BILLION Units (2018 – 2025)
9.4.3.3. Smart Materials Market Production BILLION Units (2018 – 2025)
9.4.4. Germany
9.4.4.1. Smart Materials Market Revenue $BILLION (2018 – 2025)
9.4.4.2. Smart Materials Market Consumption BILLION Units (2018 – 2025)
9.4.4.3. Smart Materials Market Production BILLION Units (2018 – 2025)
9.4.5. France
9.4.5.1. Smart Materials Market Revenue $BILLION (2018 – 2025)
9.4.5.2. Smart Materials Market Consumption BILLION Units (2018 – 2025)
9.4.5.3. Smart Materials Market Production BILLION Units (2018 – 2025)
9.4.6. Italy
9.4.6.1. Smart Materials Market Revenue $BILLION (2018 – 2025)
9.4.6.2. Smart Materials Market Consumption BILLION Units (2018 – 2025)
9.4.6.3. Smart Materials Market Production BILLION Units (2018 – 2025)
9.4.7. Rest of Europe
9.4.7.1. Smart Materials Market Revenue $BILLION (2018 – 2025)
9.4.7.2. Smart Materials Market Consumption BILLION Units (2018 – 2025)
9.4.7.3. Smart Materials Market Production BILLION Units (2018 – 2025)
9.5. ASIA PACIFIC
9.5.1. Current Trends and Future Prospects
9.5.2. Europe market revenue, sales and production volume, 2018 – 2025
9.5.3. India
9.5.3.1. Smart Materials Market Revenue $BILLION (2018 – 2025)
9.5.3.2. Smart Materials Market Consumption BILLION Units (2018 – 2025)
9.5.3.3. Smart Materials Market Production BILLION Units (2018 – 2025)
9.5.4. Japan
9.5.4.1. Smart Materials Market Revenue $BILLION (2018 – 2025)
9.5.4.2. Smart Materials Market Consumption BILLION Units (2018 – 2025)
9.5.4.3. Smart Materials Market Production BILLION Units (2018 – 2025)
9.5.5. China
9.5.5.1. Smart Materials Market Revenue $BILLION (2018 – 2025)
9.5.5.2. Smart Materials Market Consumption BILLION Units (2018 – 2025)
9.5.5.3. Smart Materials Market Production BILLION Units (2018 – 2025)
9.5.6. South Korea
9.5.6.1. Smart Materials Market Revenue $BILLION (2018 – 2025)
9.5.6.2. Smart Materials Market Consumption BILLION Units (2018 – 2025)
9.5.6.3. Smart Materials Market Production BILLION Units (2018 – 2025)
9.5.7. Rest of APAC
9.5.7.1. Smart Materials Market Revenue $BILLION (2018 – 2025)
9.5.7.2. Smart Materials Market Consumption BILLION Units (2018 – 2025)
9.5.7.3. Smart Materials Market Production BILLION Units (2018 – 2025)
9.6. REST OF THE WORLD
9.6.1. Current Trends and Future Prospects
9.6.2. Europe market revenue, sales and production volume, 2018 – 2025
9.6.3. Latin America
9.6.3.1. Smart Materials Market Revenue $BILLION (2018 – 2025)
9.6.3.2. Smart Materials Market Consumption BILLION Units (2018 – 2025)
9.6.3.3. Smart Materials Market Production BILLION Units (2018 – 2025)
9.6.4. Middle East
9.6.4.1. Smart Materials Market Revenue $BILLION (2018 – 2025)
9.6.4.2. Smart Materials Market Consumption BILLION Units (2018 – 2025)
9.6.4.3. Smart Materials Market Production BILLION Units (2018 – 2025)
9.6.5. Africa
9.6.5.1. Smart Materials Market Revenue $BILLION (2018 – 2025)
9.6.5.2. Smart Materials Market Consumption BILLION Units (2018 – 2025)
9.6.5.3. Smart Materials Market Production BILLION Units (2018 – 2025)
CHAPTER 10. KEY VENDOR PROFILES
10.1. Advanced Cerametrics Incorporated
10.1.1. Company overview
10.1.2. Portfolio Analysis
10.1.3. Estimated revenue from smart materials business and market share
10.1.4. Regional & business segment Revenue Analysis
10.2. Channel Technologies Group LLC
10.2.1. Company overview
10.2.2. Portfolio Analysis
10.2.3. Estimated revenue from smart materials business and market share
10.2.4. Regional & business segment Revenue Analysis
10.3. Ceram Tech GmbH
10.3.1. Company overview
10.3.2. Portfolio Analysis
10.3.3. Estimated revenue from smart materials business and market share
10.3.4. Regional & business segment Revenue Analysis
10.4. APC International Limited
10.4.1. Company overview
10.4.2. Portfolio Analysis
10.4.3. Estimated revenue from smart materials business and market share
10.4.4. Regional & business segment Revenue Analysis
10.5. Wright Medical Group Incorporated
10.5.1. Company overview
10.5.2. Portfolio Analysis
10.5.3. Estimated revenue from smart materials business and market share
10.5.4. Regional & business segment Revenue Analysis
10.6. Kyocera Corporation
10.6.1. Company overview
10.6.2. Portfolio Analysis
10.6.3. Estimated revenue from smart materials business and market share
10.6.4. Regional & business segment Revenue Analysis
10.7. CTS Corporation
10.7.1. Company overview
10.7.2. Portfolio Analysis
10.7.3. Estimated revenue from smart materials business and market share
10.7.4. Regional & business segment Revenue Analysis
10.8. NOLIAC A/S
10.8.1. Company overview
10.8.2. Portfolio Analysis
10.8.3. Estimated revenue from smart materials business and market share
10.8.4. Regional & business segment Revenue Analysis
10.9. TDK Corporation
10.9.1. Company overview
10.9.2. Portfolio Analysis
10.9.3. Estimated revenue from smart materials business and market share
10.9.4. Regional & business segment Revenue Analysis
10.10. LORD Corporation
10.10.1. Company overview
10.10.2. Portfolio Analysis
10.10.3. Estimated revenue from smart materials business and market share
10.10.4. Regional & business segment Revenue Analysis
PURCHASE OPTIONS
20% Free Customization ON ALL PURCHASE
*Terms & Conditions Apply
Looking for report on this market in a particular region or country? Get In Touch
Request Free Sample
Please fill in the form below to Request for free Sample Report
-
Office Hours Mon - Sat 10:00 - 16:00
-
Call Us +91 6201075429
-
Send Us Mail sales@marketdecipher.com
Market Decipher is a market research and consultancy firm involved in provision of market reports to organisations of varied sizes; small, large and medium.

© 2018 Market Decipher. All Rights Reserved