Smart toys Market
Smart toys Market By Toy type (App-enabled mechanical toys, Toys-to-life, Voice/image recognition toys, Screenless toys, Puzzles, Building games and Health tracking toys/wearable), By Technology, By Interfacing Devices (Smartphone-connected toys, Console-connected toys, Tablet-connected toys and App-connected drones), By Distribution channels (Specialty stores, Online markets and Toy shops), By age group (8-12 years, 6-8 years, 2-5 years, adults and teenagers), By Region (North America, Europe, APAC and Rest of the World)
- Report ID : MD1133 |
- Pages : 195 |
- Tables : 87 |
- Formats :


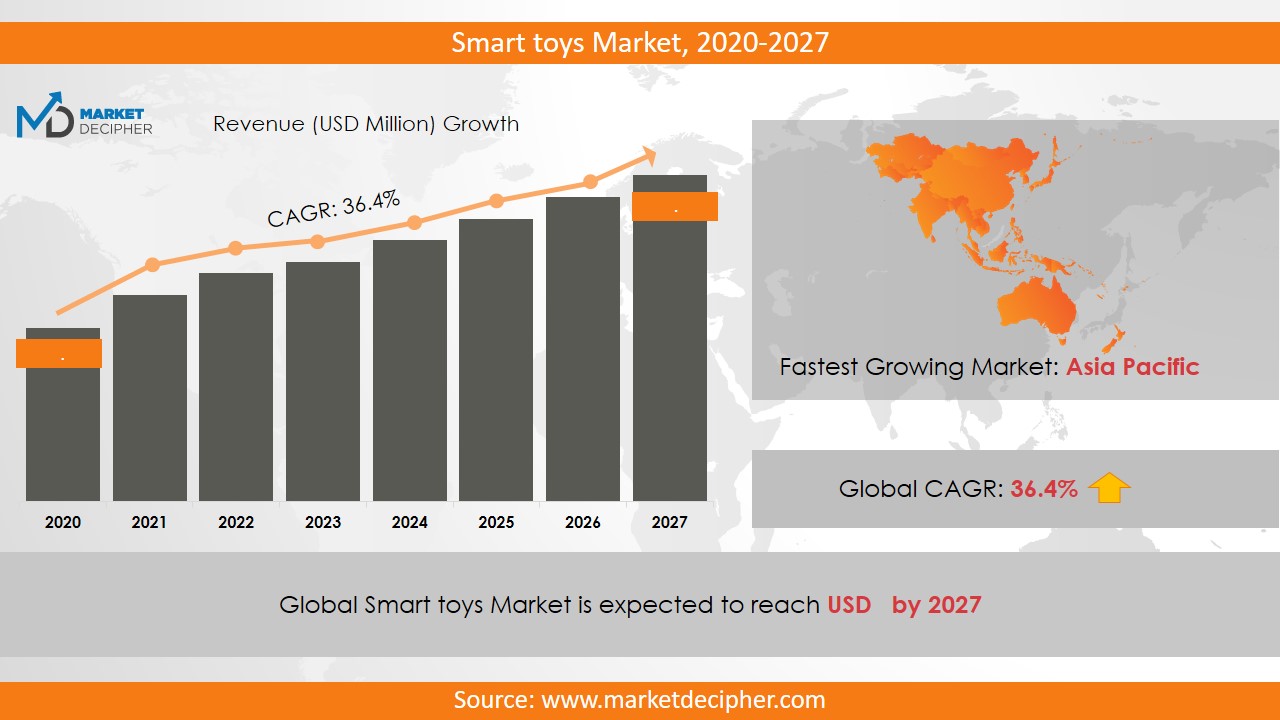
Smart Toys market revenue shall reach a value of $68,534.8 Million in 2026, growing with a CAGR of 29.8% during the forecast period of 2019 to 2026. In terms of volume sales, the market is anticipated to reach XX Units.
Smart toys are getting acceptance across the world due to the increase in disposable incomes of consumers and thus, there has been a tremendous increase in market revenue in the last few years. The growing demand for Internet-based toys since the last few years is significantly increasing the market revenue. Apart from this, people are becoming familiar with advanced technology and the growing production of interconnected toys has increased considerably over the last few years. Consequently, almost every age group is accepting these toys greatly. Further, the increasing technological advancement and growth in the field of toys have greatly increased the overall smart toys market shares.
Declining involvement of students in math and science projects in Australia may pose challenges in the smart toys market growth. Due to the rising commercialization, many people find it easier to search for a product online than visiting & searching in a shopping store. Thus, the rise in online sales has increased the overall market revenue up to a great extent. Moreover, the easy integration of this industry with other technical industries is a major factor in augmenting the smart toy market sales.
REGIONAL ANALYSIS
In 2018, North America has dominated the market in terms of revenue. The rising number of development activities are driving the revenue of the market in North America. Further, this region is anticipated to fuel up the market revenue significantly over the forecast period owing to rising investment by countries such as the U.S and Canada. Moreover, the Europe and Asia Pacific regions are also anticipated to grow significantly over the forecast period owing to the heavy competition among the industry players in these regions.
SEGMENT ANALYSIS
Based on toy types, the smart toys market report provides a detailed analysis of app-enabled mechanical toys, toys-to-life, voice/image recognition toys, screen fewer toys, puzzles, building games and health tracking toys/wearable. By interfacing surfaces, the market has been segmented as smartphone-connected toys, console-connected toys, tablet-connected toys, and app-connected drones. Significant technologies used in manufacturing smart toys are Bluetooth, RFID/NFC, and Wi-Fi. Major distribution channels are specialty stores, online channel and toy shops. By age group, the classification has been done as 8-12 years, 6-8 years, 2-5 years, adults and teenagers.
INDUSTRY PLAYER ANALYSIS
Major industry players have been analyzed with coverage on their operating areas, revenues, and other strategic aspects. These industry players include Hasbro Incorporated, Mattel Incorporated, The Lego Group, Sony Corporation, Jakks Pacific Incorporated, Playmobil, Konami Corporation, Leapfrog Entertainment, Kid II Incorporated and KNex Industries Incorporated.
COVERAGE HIGHLIGHTS
• Revenue Estimation and Forecast (2018 – 2026)
• Production Estimation and Forecast (2018 – 2026)
• Sales/Consumption Volume Estimation and Forecast (2018 – 2026)
• Breakdown of Revenue by Segments (2018 – 2026)
• Breakdown of Production by Segments (2018 – 2026)
• Breakdown of Sales Volume by Segments (2018 – 2026)
• Gross Margin and Profitability Analysis of Companies
• Business Trend and Expansion Analysis
• Import and Export Analysis
• Regional Analysis and Data Breakdown
SEGMENTAL ANALYSIS:
By Toy Type Outlook ($Revenue and Unit Sales, 2018-2026)
· App- enabled mechanical toys
· Toys-to-life
· Voice/Image recognition toys
· Screen fewer toys
· Puzzles
· Building games
· Health tracking toys/wearable
By Interfacing devices Outlook ($Revenue and Unit Sales, 2018-2026)
· Smartphone-connected toys
· Console-connected toys
· Tablet-connected toys
· App-connected drones
By Technology Outlook ($Revenue and Unit Sales, 2018-2026)
• Bluetooth
• RFID/NFC
• Wi-Fi
By Distribution Channel Outlook ($Revenue and Unit Sales, 2018-2026)
• Specialty stores
• Online
• Toy shops
By Age Group Outlook ($Revenue and Unit Sales, 2018-2026)
· 8-12 years
· 6-8 years
· 2-5 years
· Teenagers
· Adults
By Regional Outlook ($Revenue and Unit Sales, 2018-2026)
• North America
• Canada
• U.S
• Mexico
• Europe
• Germany
• U.K
• France
• Netherlands
• Austria
• Rest of Europe
• Asia-Pacific
• China
• India
• Japan
• South Korea
• Australia
• Rest of Asia Pacific
• The Middle East and Africa
• Saudi Arabia
• United Arab Emirates
• Rest of Middle East
• Africa
• South America
• Brazil
• Argentina
• Rest of South America
INDUSTRY PLAYERS ANALYSIS:
· Hasbro Incorporated
· Mattel Incorporated
· The Lego Group
· Sony Corporation
· Jakks Pacific Incorporated
· Playmobil
· Konami Corporation
· Leapfrog Entertainment
· Kid II Incorporated
· KNex Industries Incorporated
CHAPTER 1. INTRODUCTION
1.1. RESEARCH METHODOLOGY
1.1.1. Data Collection
1.1.2. Data Modeling
1.1.3. Historical Revenue and Sales Estimation
1.1.4. Data Triangulation
1.2. RESEARCH PROCESS
1.2.1. Primary Research
1.2.2. Secondary Research
1.2.3. Survey Data
1.2.4. Validation by In-House Expert
1.3. SMART TOYS MARKET OVERVIEW
1.3.1. Research Scope and Market Definition
1.3.2. Executive Summary
CHAPTER 2. GLOBAL SMART TOYS MARKET DEMAND SIDE ANALYSIS
2.1. SMART TOYS MARKET CONSUMPTION VOLUME (MILLION UNITS), 2018 – 2025
2.2. MARKET CONSUMPTION VOLUME SPLIT BY REGION (MILLION UNITS), 2018 – 2025
2.3. MARKET CONSUMPTION VOLUME SPLIT BY COUNTRIES (MILLION UNITS), 2018 – 2025
2.4. MARKET REVENUE (MILLION USD), 2018-2025
2.5. MARKET REVENUE SPLIT BY REGION (MILLION UNITS), 2018 – 2025
2.6. SMART TOYS MARKET REVENUE SPLIT BY COUNTRIES (MILLION UNITS), 2018 – 2025
CHAPTER 3. GLOBAL SMART TOYS MARKET SUPPLY SIDE ANALYSIS
3.1. SMART TOYS MARKET PRODUCTION VOLUME (MILLION UNITS), 2018 – 2025
3.2. MARKET PRODUCTION VOLUME SPLIT BY REGION (MILLION UNITS), 2018-2025
3.3. MARKET PRODUCTION VOLUME SPLIT/RANKING BY COUNTRIES (MILLION UNITS), 2018 – 2025
CHAPTER 4. GLOBAL SMART TOYS MARKET COMPETITIVE SCENARIO & BUSINESS OPPORTUNITY ANALYSIS
4.1. COMPETITIVE STRENGTH RANKING BY MAJOR COUNTRIES, 2018
4.2. MARKET ATTRACTIVENESS RANKING BY MAJOR COUNTRIES, 2018 - 2025
4.3. EMERGING BUSINESS OPPORTUNITIES AND GROWTH PROSPECTS
4.3.1. Growth Drivers
4.3.2. Market Restraints
4.3.2. Opportunities
CHAPTER 5. GLOBAL SMART TOYS MARKET ENTRY STRATEGIES
5.1. ENTRY STRATEGIES IN DEVELOPING MARKETS
5.2. ENTRY STRATEGIES IN DEVELOPED MARKETS
CHAPTER 6. GLOBAL SMART TOYS MARKET BY TOY TYPE
6.1. SEGMENT OUTLINE
6.2. REVENUE SHARE BY TOY TYPE, $MILLION, 2018 – 2025
6.2. CONSUMPTION SHARE BY TOY TYPE, MILLION UNITS, 2018 - 2025
6.3. PRODUCTION SHARE BY TOY TYPE, MILLION UNITS, 2018 – 2025
6.4. APP- ENABLED MECHANICAL TOYS
6.4.1. Market determinants and trend analysis
6.4.2. Market revenue, sales and production volume, 2018 – 2025
6.5. TOYS-TO-LIFE
6.5.1. Market determinants and trend analysis
6.5.2. Market revenue, sales and production volume, 2018 – 2025
6.6. VOICE/IMAGE RECOGNITION TOYS
6.6.1. Market determinants and trend analysis
6.6.2. Market revenue, sales and production volume, 2018 – 2025
6.7.SCREEN LESS TOYS
6.7.1. Market determinants and trend analysis
6.7.2. Market revenue, sales and production volume, 2018 – 2025
6.8. PUZZLES
6.8.1. Market determinants and trend analysis
6.8.2. Market revenue, sales and production volume, 2018 – 2025
6.9. BUILDING GAMES
6.9.1. Market determinants and trend analysis
6.9.2. Market revenue, sales and production volume, 2018 – 2025
6.10. HEALTH TRACKING TOYS/WEARABLE
6.9.1. Market determinants and trend analysis
6.9.2. Market revenue, sales and production volume, 2018 – 2025
CHAPTER 7. GLOBAL SMART TOYS MARKET BY INTERFACING DEVICES
7.1. SEGMENT OUTLINE
7.2. REVENUE SHARE BY INTERFACING DEVICES, $MILLION, 2018 – 2025
7.2. CONSUMPTION SHARE BY INTERFACING DEVICES, MILLION UNITS, 2018 - 2025
7.3. PRODUCTION SHARE BY INTERFACING DEVICES, MILLION UNITS, 2018 – 2025
7.4. SMARTPHONE-CONNECTED TOYS
7.4.1. Market determinants and trend analysis
7.4.2. Market revenue, sales and production volume, 2018 – 2025
7.5. CONSOLE-CONNECTED TOYS
7.5.1. Market determinants and trend analysis
7.5.2. Market revenue, sales and production volume, 2018 – 2025
7.6. TABLET-CONNECTED TOYS
7.6.1. Market determinants and trend analysis
7.6.2. Market revenue, sales and production volume, 2018 – 2025
7.7. APP-CONNECTED DRONES
7.7.1. Market determinants and trend analysis
7.7.2. Market revenue, sales and production volume, 2018 – 2025
CHAPTER 8. GLOBAL SMART TOYS MARKET BY TECHNOLOGY
8.1. SEGMENT OUTLINE
8.2. REVENUE SHARE BY TECHNOLOGY, $MILLION, 2018 – 2025
8.2. CONSUMPTION SHARE BY TECHNOLOGY, MILLION UNITS, 2018 - 2025
8.3. PRODUCTION SHARE BY TECHNOLOGY, MILLION UNITS, 2018 – 2025
8.4. BLUETOOTH
8.4.1. Market determinants and trend analysis
8.4.2. Market revenue, sales and production volume, 2018 – 2025
8.5. RFID/NFC
8.5.1. Market determinants and trend analysis
8.5.2. Market revenue, sales and production volume, 2018 – 2025
8.6. WI-FI
8.6.1. Market determinants and trend analysis
8.6.2. Market revenue, sales and production volume, 2018 – 2025
CHAPTER 9. GLOBAL SMART TOYS MARKET BY DISTRIBUTION CHANNEL
9.1. SEGMENT OUTLINE
9.2. REVENUE SHARE BY DISTRIBUTION CHANNEL, $MILLION, 2018 – 2025
9.2. CONSUMPTION SHARE BY DISTRIBUTION CHANNEL, MILLION UNITS, 2018 - 2025
9.3. PRODUCTION SHARE BY DISTRIBUTION CHANNEL, MILLION UNITS, 2018 – 2025
9.4. SPECIALTY STORES
9.4.1. Market determinants and trend analysis
9.4.2. Market revenue, sales and production volume, 2018 – 2025
9.5. ONLINE MARKET
9.5.1. Market determinants and trend analysis
9.5.2. Market revenue, sales and production volume, 2018 – 2025
9.6. TOY SHOPS
9.6.1. Market determinants and trend analysis
9.6.2. Market revenue, sales and production volume, 2018 – 2025
CHAPTER 10. GLOBAL SMART TOYS MARKET BY AGE GROUP
10.1. SEGMENT OUTLINE
10.2. REVENUE SHARE BY AGE GROUP, $MILLION, 2018 – 2025
10.2. CONSUMPTION SHARE BY AGE GROUP, MILLION UNITS, 2018 - 2025
10.3. PRODUCTION SHARE BY AGE GROUP, MILLION UNITS, 2018 – 2025
10.4. 8-12 YEARS
10.4.1. Market determinants and trend analysis
10.4.2. Market revenue, sales and production volume, 2018 – 2025
10.5. 6-8 YEARS
10.5.1. Market determinants and trend analysis
10.5.2. Market revenue, sales and production volume, 2018 – 2025
10.6. 2-5 YEARS
10.6.1. Market determinants and trend analysis
10.6.2. Market revenue, sales and production volume, 2018 – 2025
10.7. TEENAGERS
10.7.1. Market determinants and trend analysis
10.7.2. Market revenue, sales and production volume, 2018 – 2025
10.8. ADULTS
10.8.1. Market determinants and trend analysis
10.8.2. Market revenue, sales and production volume, 2018 – 2025
CHAPTER 11. GLOBAL SMART TOYS MARKET BY REGIONS
11.1. REGIONAL OUTLOOK
11.2. MARKET PRODUCTION, CONSUMPTION & REVENUE BY REGION, 2018-2025
11.3. NORTH AMERICA
11.3.1. Current Trends and Future Prospects
11.3.2. North America market revenue, sales and production volume, 2018 – 2025
11.3.3.U.S.
11.3.3.1. Smart Toys Market Revenue $Million (2018 – 2025)
11.3.3.2. Smart Toys Market Consumption Million Units (2018 – 2025)
11.3.3.3. Smart Toys Market Production Million Units (2018 – 2025)
11.3.4. Canada
11.3.4.1. Smart Toys Market Revenue $Million (2018 – 2025)
11.3.4.2. Smart Toys Market Consumption Million Units (2018 – 2025)
11.3.4.3. Smart Toys Market Production Million Units (2018 – 2025)
11.3.5. Mexico
11.3.5.1. Smart Toys Market Revenue $Million (2018 – 2025)
11.3.5.2. Smart Toys Market Consumption Million Units (2018 – 2025)
11.3.5.3. Smart Toys Market Production Million Units (2018 – 2025)
11.4. EUROPE
11.4.1. Current Trends and Future Prospects
11.4.2. Europe market revenue, sales and production volume, 2018 – 2025
11.4.3. U.K
11.4.3.1. Smart Toys Market Revenue $Million (2018 – 2025)
11.4.3.2. Smart Toys Market Consumption Million Units (2018 – 2025)
11.4.3.3. Smart Toys Market Production Million Units (2018 – 2025)
11.4.4. Germany
11.4.4.1. Smart Toys Market Revenue $Million (2018 – 2025)
11.4.4.2. Smart Toys Market Consumption Million Units (2018 – 2025)
11.4.4.3. Smart Toys Market Production Million Units (2018 – 2025)
11.4.5. France
11.4.5.1. Smart Toys Market Revenue $Million (2018 – 2025)
11.4.5.2. Smart Toys Market Consumption Million Units (2018 – 2025)
11.4.5.3. Smart Toys Market Production Million Units (2018 – 2025)
11.4.6. Italy
11.4.6.1. Smart Toys Market Revenue $Million (2018 – 2025)
11.4.6.2. Smart Toys Market Consumption Million Units (2018 – 2025)
11.4.6.3. Smart Toys Market Production Million Units (2018 – 2025)
11.4.7. Rest of Europe
11.4.7.1. Smart Toys Market Revenue $Million (2018 – 2025)
11.4.7.2. Smart Toys Market Consumption Million Units (2018 – 2025)
11.4.7.3. Smart Toys Market Production Million Units (2018 – 2025)
11.5. ASIA PACIFIC
11.5.1. Current Trends and Future Prospects
11.5.2. Europe market revenue, sales and production volume, 2018 – 2025
11.5.3. India
11.5.3.1. Smart Toys Market Revenue $Million (2018 – 2025)
11.5.3.2. Smart Toys Market Consumption Million Units (2018 – 2025)
11.5.3.3. Smart Toys Market Production Million Units (2018 – 2025)
11.5.4. Japan
11.5.4.1. Smart Toys Market Revenue $Million (2018 – 2025)
11.5.4.2. Smart Toys Market Consumption Million Units (2018 – 2025)
11.5.4.3. Smart Toys Market Production Million Units (2018 – 2025)
11.5.5. China
11.5.5.1. Smart Toys Market Revenue $Million (2018 – 2025)
11.5.5.2. Smart Toys Market Consumption Million Units (2018 – 2025)
11.5.5.3. Smart Toys Market Production Million Units (2018 – 2025)
11.5.6. South Korea
11.5.6.1. Smart Toys Market Revenue $Million (2018 – 2025)
11.5.6.2. Smart Toys Market Consumption Million Units (2018 – 2025)
11.5.6.3. Smart Toys Market Production Million Units (2018 – 2025)
11.5.7. Rest of APAC
11.5.7.1. Smart Toys Market Revenue $Million (2018 – 2025)
11.5.7.2. Smart Toys Market Consumption Million Units (2018 – 2025)
11.5.7.3. Smart Toys Market Production Million Units (2018 – 2025)
11.6. REST OF THE WORLD
11.6.1. Current Trends and Future Prospects
11.6.2. Europe market revenue, sales and production volume, 2018 – 2025
11.6.3. Latin America
11.6.3.1. Smart Toys Market Revenue $Million (2018 – 2025)
11.6.3.2. Smart Toys Market Consumption Million Units (2018 – 2025)
11.6.3.3. Smart Toys Market Production Million Units (2018 – 2025)
11.6.4. Middle East
11.6.4.1. Smart Toys Market Revenue $Million (2018 – 2025)
11.6.4.2. Smart Toys Market Consumption Million Units (2018 – 2025)
11.6.4.3. Smart Toys Market Production Million Units (2018 – 2025)
11.6.5. Africa
11.6.5.1. Smart Toys Market Revenue $Million (2018 – 2025)
11.6.5.2. Smart Toys Market Consumption Million Units (2018 – 2025)
11.6.5.3. Smart Toys Market Production Million Units (2018 – 2025)
CHAPTER 12. KEY VENDOR PROFILES
12.1. Hasbro Incorporated
12.1.1. Company overview
12.1.2. Portfolio Analysis
12.1.3. Estimated revenue from smart toys business and market share
12.1.4. Regional & business segment Revenue Analysis
12.2. Mattel Incorporated
12.2.1. Company overview
12.2.2. Portfolio Analysis
12.2.3. Estimated revenue from smart toys business and market share
12.2.4. Regional & business segment Revenue Analysis
12.3. The Lego Group
12.3.1. Company overview
12.3.2. Portfolio Analysis
12.3.3. Estimated revenue from smart toys business and market share
12.3.4. Regional & business segment Revenue Analysis
12.4. Sony Corporation
12.4.1. Company overview
12.4.2. Portfolio Analysis
12.4.3. Estimated revenue from smart toys business and market share
12.4.4. Regional & business segment Revenue Analysis
12.5. Jakks Pacific Incorporated
12.5.1. Company overview
12.5.2. Portfolio Analysis
12.5.3. Estimated revenue from smart toys business and market share
12.5.4. Regional & business segment Revenue Analysis
12.6. Playmobil
12.6.1. Company overview
12.6.2. Portfolio Analysis
12.6.3. Estimated revenue from smart toys business and market share
12.6.4. Regional & business segment Revenue Analysis
12.7. Konami Corporation
12.7.1. Company overview
12.7.2. Portfolio Analysis
12.7.3. Estimated revenue from smart toys business and market share
12.7.4. Regional & business segment Revenue Analysis
12.8. Leapfrog Entertainment
12.8.1. Company overview
12.8.2. Portfolio Analysis
12.8.3. Estimated revenue from smart toys business and market share
12.8.4. Regional & business segment Revenue Analysis
12.9. Kid II Incorporated
12.9.1. Company overview
12.9.2. Portfolio Analysis
12.9.3. Estimated revenue from smart toys business and market share
12.9.4. Regional & business segment Revenue Analysis
12.10. KNex Industries Incorporated
12.10.1. Company overview
12.10.2. Portfolio Analysis
12.10.3. Estimated revenue from smart toys business and market share
12.10.4. Regional & business segment Revenue Analysis
PURCHASE OPTIONS
20% Free Customization ON ALL PURCHASE
*Terms & Conditions Apply
Looking for report on this market in a particular region or country? Get In Touch
Request Free Sample
Please fill in the form below to Request for free Sample Report
-
Office Hours Mon - Sat 10:00 - 16:00
-
Call Us +91 6201075429
-
Send Us Mail sales@marketdecipher.com
Market Decipher is a market research and consultancy firm involved in provision of market reports to organisations of varied sizes; small, large and medium.

© 2018 Market Decipher. All Rights Reserved