Technical Illustration Software Market
By Component (Software and Services), By Technology (2D and 3D), By End-Use (Aerospace, Energy and power, Defense, Manufacturing, Transportation, Healthcare and Automotive), By Region (North America, Europe, APAC and Rest of the World)
- Report ID : MD1123 |
- Pages : 185 |
- Tables : 76 |
- Formats :


Technical illustration software is used for designing and using illustrations. This software allows the user to demonstrate both in 2D and 3D, which facilitates the illustration of the design of a particular model more efficiently. Additionally, the widespread application of this software in diverse sectors such as aerospace, energy and electricity, defense, manufacturing, transport, health and automotive is expected to drive the technical illustration software market shares remarkably. This software provides several features that prove to be helpful for illustrators to provide aesthetically & technically efficient models.
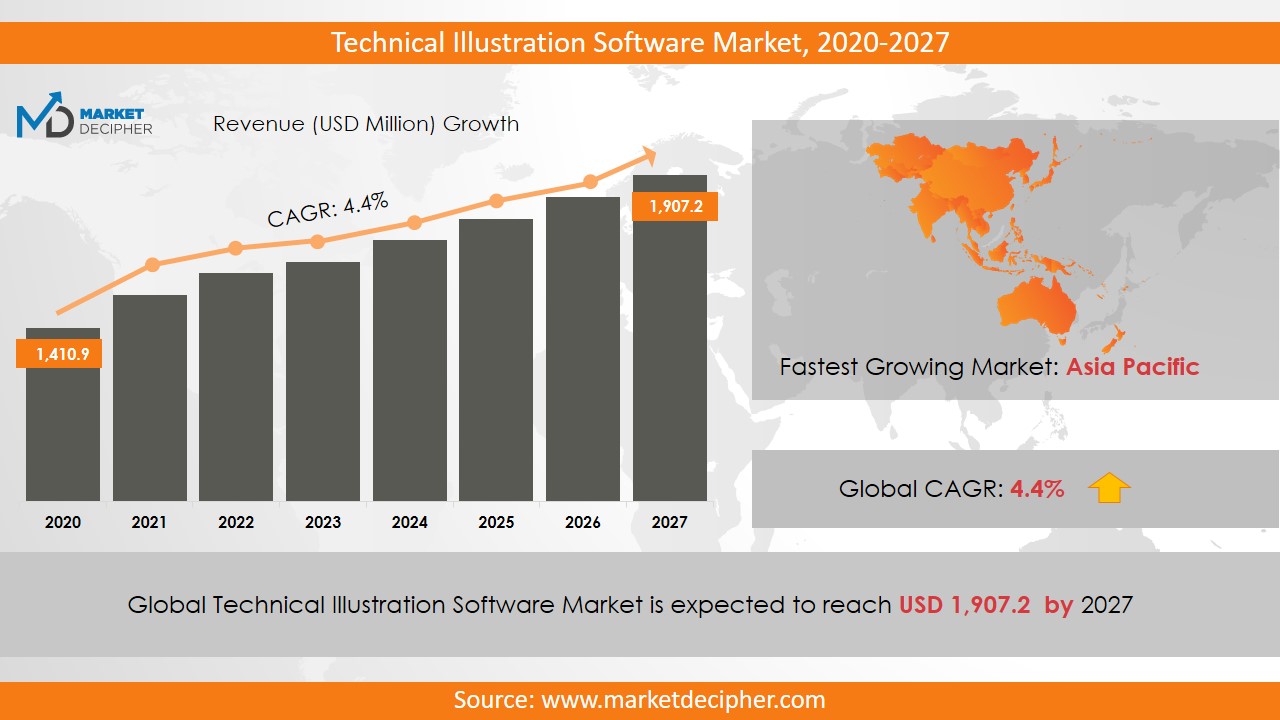
Technical Illustration software market revenue shall reach a value of $ 3,958.4 Million in 2031, growing with a CAGR of 5.3% during the forecast period of 2022 to 2031.
Along with the ease of operation and availability of large storage space in cloud-based services, the trend of using this service is snowballing progressively. Also, the increasing number of innovation & development activities in the manufacturing and transport sector is also playing a vital role in the technical illustration software market growth. The growing trend of working as a freelancer in the design and illustration field is greatly increasing the technical illustration software market revenue. As the software highlights all the technical aspects of a product before it is rolled out for prototyping, it has become an essential element for designing and illustrating in various sectors.
REGIONAL ANALYSIS
North America and Europe regions are the dominant regions in expanding the technical illustration software market size in 2022. Europe and Asia Pacific regions are anticipated to witness a tremendous increase in their revenue over the forecast period owing to the rising number of research and development activities in the region. Further, the rising adoption of this technology in Middle East Africa and South America is anticipated to garner significant revenue in the coming few years.
SEGMENT ANALYSIS
Based on components, the industry has been segmented as software and services. The software segment is further bifurcated as on-premise and cloud. Further, the services segment is segmented as support and maintenance, implementation and training and consulting. Out of this, the support and maintenance segment dominated the market revenue significantly in 2022. According to a recent technical illustration software market analysis, based on technology, the 3D technology generated the greatest revenue. By end use, the segmentation has been done as aerospace, energy and power, defense, manufacturing, transportation, healthcare and automotive. In 2022, manufacturing industries established their dominance over the forecast period in the forecast period. However, it is estimated that during the forecast period, the cloud segment will generate the largest revenue for the market due to the increasing deployment of cloud services in many industries.
The defense sector is expected to adopt this software extensively owing to the rising concerns about the safety of infrastructure from terrorist attacks. In 2022, the automotive sector dominated the technical illustration software business in terms of revenue. Further, the media and entertainment industries also adopted this software greatly in recent years.
INDUSTRY PLAYER ANALYSIS
Major industry players have been analyzed with coverage on their operating areas, revenues, and other strategic aspects. These Industry players include Autodesk Incorporated, Dassault Systems, Canvas GFX Incorporated, Corel Corporation, PTC Incorporated, Siemens Product Lifecycle Management Software Inc., Cyient, QuadriSpace Corporation, and Auto-Trol Technology Corporation. These players are concentrating on acquisitions and new strategies to increase technical illustration software market size in the coming years. Other industries in this domain that are growing at a high CAGR include Manufacturing Operations Management Software Market and Exploration and Production Software Market.
COVERAGE HIGHLIGHTS
• Revenue Estimation and Forecast (2022 – 2031)
• Sales Estimation and Forecast (2022 – 2031)
• Breakdown of Revenue by Segments (2022 – 2031)
• Breakdown of Sales by Segments (2022 – 2031)
• Gross Margin and Profitability Analysis of Companies
• Business Trend and Expansion Analysis
• Regional Analysis and Data Breakdown
SEGMENTAL ANALYSIS:
By Component Outlook ($Revenue and Unit Sales, 2022-2031)
• Software
• Cloud
• On-premise
• Services
• Support and maintenance
• Implementation
• Training and support
By Technology Outlook ($Revenue and Unit Sales, 2022-2031)
· 3D
· 2D
By End Use Outlook ($Revenue and Unit Sales, 2022-2031)
· Aerospace
· Energy and power
· Defense
· Manufacturing
· Transportation
· Healthcare
· Automotive
By Regional Outlook ($Revenue and Unit Sales, 2022-2031)
• North America
• Canada
• U.S
• Mexico
• Europe
• Germany
• U.K
• France
• Netherlands
• Austria
• Rest of Europe
• Asia-Pacific
• China
• India
• Japan
• South Korea
• Australia
• Rest of Asia Pacific
• The Middle East and Africa
• Saudi Arabia
• United Arab Emirates
• Rest of Middle East
• Africa
• South America
• Brazil
• Argentina
• Rest of South America
INDUSTRY PLAYERS ANALYSIS:
· Autodesk Incorporated
· Dassault Systemes
· Canvas GFX Incorporated
· Corel Corporation
· PTC Incorporated
· Siemens Product Lifecycle Management Software Inc.
· Cyient
· QuadriSpace Corporation
· Auto-Trol Technology Corporation
Need Report on a particular Country OR need a Tailored/Customized Research? Budget Limits/Price Discounts Query...!
Email to David Correa
OR Fill the below "Sample Request FORM" with your queries in the message box.
CHAPTER 1. INTRODUCTION
1.1. RESEARCH METHODOLOGY
1.1.1. Data Collection
1.1.2. Data Modeling
1.1.3. Historical Revenue and Sales Estimation
1.1.4. Data Triangulation
1.2. RESEARCH PROCESS
1.2.1. Primary Research
1.2.2. Secondary Research
1.2.3. Survey Data
1.2.4. Validation by In-House Expert
1.3. TECHNICAL ILLUSTRATION SOFTWARE MARKET OVERVIEW
1.3.1. Research Scope and Market Definition
1.3.2. Executive Summary
CHAPTER 2. GLOBAL TECHNICAL ILLUSTRATION SOFTWARE MARKET DEMAND SIDE ANALYSIS
2.1. TECHNICAL ILLUSTRATION SOFTWARE MARKET CONSUMPTION VOLUME (MILLION UNITS), 2018 – 2025
2.2. MARKET CONSUMPTION VOLUME SPLIT BY REGION (MILLION UNITS), 2018 – 2025
2.3. MARKET CONSUMPTION VOLUME SPLIT BY COUNTRIES (MILLION UNITS), 2018 – 2025
2.4. MARKET REVENUE (MILLION USD), 2018-2025
2.5. MARKET REVENUE SPLIT BY REGION (MILLION UNITS), 2018 – 2025
2.6. TECHNICAL ILLUSTRATION SOFTWARE MARKET REVENUE SPLIT BY COUNTRIES (MILLION UNITS), 2018 – 2025
CHAPTER 3. GLOBAL TECHNICAL ILLUSTRATION SOFTWARE MARKET SUPPLY SIDE ANALYSIS
3.1. TECHNICAL ILLUSTRATION SOFTWARE MARKET PRODUCTION VOLUME (MILLION UNITS), 2018 – 2025
3.2. MARKET PRODUCTION VOLUME SPLIT BY REGION (MILLION UNITS), 2018-2025
3.3. MARKET PRODUCTION VOLUME SPLIT/RANKING BY COUNTRIES (MILLION UNITS), 2018 – 2025
CHAPTER 4. GLOBAL TECHNICAL ILLUSTRATION SOFTWARE MARKET COMPETITIVE SCENARIO & BUSINESS OPPORTUNITY ANALYSIS
4.1. COMPETITIVE STRENGTH RANKING BY MAJOR COUNTRIES, 2018
4.2. MARKET ATTRACTIVENESS RANKING BY MAJOR COUNTRIES, 2018 - 2025
4.3. EMERGING BUSINESS OPPORTUNITIES AND GROWTH PROSPECTS
4.3.1. Growth Drivers
4.3.2. Market Restraints
4.3.2. Opportunities
CHAPTER 5. GLOBAL TECHNICAL ILLUSTRATION SOFTWARE MARKET ENTRY STRATEGIES
5.1. ENTRY STRATEGIES IN DEVELOPING MARKETS
5.2. ENTRY STRATEGIES IN DEVELOPED MARKETS
CHAPTER 6. GLOBAL TECHNICAL ILLUSTRATION SOFTWARE MARKET BY COMPONENT
6.1. SEGMENT OUTLINE
6.2. REVENUE SHARE BY COMPONENT, $MILLION, 2018 – 2025
6.2. CONSUMPTION SHARE BY COMPONENT, MILLION UNITS, 2018 - 2025
6.3. PRODUCTION SHARE BY COMPONENT, MILLION UNITS, 2018 – 2025
6.4. SOFTWARE
6.4.1. Market determinants and trend analysis
6.4.2. Market revenue, sales and production volume, 2018 – 2025
6.4.3. Cloud
6.4.3.1. Market revenue, sales and production volume, 2018 – 2025
6.4.4. On premise
6.4.4.1. Market revenue, sales and production volume, 2018 – 2025
6.5. SERVICES
6.5.1. Market determinants and trend analysis
6.5.2. Market revenue, sales and production volume, 2018 – 2025
6.5.3. Support and maintenance
6.4.3.1. Market revenue, sales and production volume, 2018 – 2025
6.5.4. Implementation
6.4.4.1. Market revenue, sales and production volume, 2018 – 2025
6.5.5. Training and support
6.4.4.1. Market revenue, sales and production volume, 2018 – 2025
CHAPTER 7. GLOBAL TECHNICAL ILLUSTRATION SOFTWARE MARKET BY TECHNOLOGY
7.1. SEGMENT OUTLINE
7.2. REVENUE SHARE BY TECHNOLOGY, $MILLION, 2018 – 2025
7.2. CONSUMPTION SHARE BY TECHNOLOGY, MILLION UNITS, 2018 - 2025
7.3. PRODUCTION SHARE BY TECHNOLOGY, MILLION UNITS, 2018 – 2025
7.4. 3D
7.4.1. Market determinants and trend analysis
7.4.2. Market revenue, sales and production volume, 2018 – 2025
7.5. 2D
7.5.1. Market determinants and trend analysis
7.5.2. Market revenue, sales and production volume, 2018 – 2025
CHAPTER 8. GLOBAL TECHNICAL ILLUSTRATION SOFTWARE MARKET BY END USE
8.1. SEGMENT OUTLINE
8.2. REVENUE SHARE BY END USE, $MILLION, 2018 – 2025
8.2. CONSUMPTION SHARE BY END USE, MILLION UNITS, 2018 - 2025
8.3. PRODUCTION SHARE BY END USE, MILLION UNITS, 2018 – 2025
8.4. AEROSPACE
8.4.1. Market determinants and trend analysis
8.4.2. Market revenue, sales and production volume, 2018 – 2025
8.5. ENERGY AND POWER
8.5.1. Market determinants and trend analysis
8.5.2. Market revenue, sales and production volume, 2018 – 2025
8.6. DEFENSE
8.6.1. Market determinants and trend analysis
8.6.2. Market revenue, sales and production volume, 2018 – 2025
8.7. MANUFACTURING
8.7.1. Market determinants and trend analysis
8.7.2. Market revenue, sales and production volume, 2018 – 2025
8.8. TRANSPORTATION
8.8.1. Market determinants and trend analysis
8.8.2. Market revenue, sales and production volume, 2018 – 2025
8.9. HEALTHCARE
8.9.1. Market determinants and trend analysis
8.9.2. Market revenue, sales and production volume, 2018 – 2025
8.10. AUTOMOTIVE
8.10.1. Market determinants and trend analysis
8.10.2. Market revenue, sales and production volume, 2018 – 2025
CHAPTER 9. GLOBAL TECHNICAL ILLUSTRATION SOFTWARE MARKET BY REGIONS
9.1. REGIONAL OUTLOOK
9.2. MARKET PRODUCTION, CONSUMPTION & REVENUE BY REGION, 2018-2025
9.3. NORTH AMERICA
9.3.1. Current Trends and Future Prospects
9.3.2. North America market revenue, sales and production volume, 2018 – 2025
9.3.3. The U.S.
9.3.3.1. Technical Illustration Software Market Revenue $Million (2018 – 2025)
9.3.3.2. Technical Illustration Software Market Consumption Million Units (2018 – 2025)
9.3.3.3. Technical Illustration Software Market Production Million Units (2018 – 2025)
9.3.4. Canada
9.3.4.1. Technical Illustration Software Market Revenue $Million (2018 – 2025)
9.3.4.2. Technical Illustration Software Market Consumption Million Units (2018 – 2025)
9.3.4.3. Technical Illustration Software Market Production Million Units (2018 – 2025)
9.3.5. Mexico
9.3.5.1. Technical Illustration Software Market Revenue $Million (2018 – 2025)
9.3.5.2. Technical Illustration Software Market Consumption Million Units (2018 – 2025)
9.3.5.3. Technical Illustration Software Market Production Million Units (2018 – 2025)
9.4. EUROPE
9.4.1. Current Trends and Future Prospects
9.4.2. Europe market revenue, sales and production volume, 2018 – 2025
9.4.3. U.K
9.4.3.1. Technical Illustration Software Market Revenue $Million (2018 – 2025)
9.4.3.2. Technical Illustration Software Market Consumption Million Units (2018 – 2025)
9.4.3.3. Technical Illustration Software Market Production Million Units (2018 – 2025)
9.4.4. Germany
9.4.4.1. Technical Illustration Software Market Revenue $Million (2018 – 2025)
9.4.4.2. Technical Illustration Software Market Consumption Million Units (2018 – 2025)
9.4.4.3. Technical Illustration Software Market Production Million Units (2018 – 2025)
9.4.5. France
9.4.5.1. Technical Illustration Software Market Revenue $Million (2018 – 2025)
9.4.5.2. Technical Illustration Software Market Consumption Million Units (2018 – 2025)
9.4.5.3. Technical Illustration Software Market Production Million Units (2018 – 2025)
9.4.6. Italy
9.4.6.1. Technical Illustration Software Market Revenue $Million (2018 – 2025)
9.4.6.2. Technical Illustration Software Market Consumption Million Units (2018 – 2025)
9.4.6.3. Technical Illustration Software Market Production Million Units (2018 – 2025)
9.4.7. Rest of Europe
9.4.7.1. Technical Illustration Software Market Revenue $Million (2018 – 2025)
9.4.7.2. Technical Illustration Software Market Consumption Million Units (2018 – 2025)
9.4.7.3. Technical Illustration Software Market Production Million Units (2018 – 2025)
9.5. ASIA PACIFIC
9.5.1. Current Trends and Future Prospects
9.5.2. Europe market revenue, sales and production volume, 2018 – 2025
9.5.3. India
9.5.3.1. Technical Illustration Software Market Revenue $Million (2018 – 2025)
9.5.3.2. Technical Illustration Software Market Consumption Million Units (2018 – 2025)
9.5.3.3. Technical Illustration Software Market Production Million Units (2018 – 2025)
9.5.4. Japan
9.5.4.1. Technical Illustration Software Market Revenue $Million (2018 – 2025)
9.5.4.2. Technical Illustration Software Market Consumption Million Units (2018 – 2025)
9.5.4.3. Technical Illustration Software Market Production Million Units (2018 – 2025)
9.5.5. China
9.5.5.1. Technical Illustration Software Market Revenue $Million (2018 – 2025)
9.5.5.2. Technical Illustration Software Market Consumption Million Units (2018 – 2025)
9.5.5.3. Technical Illustration Software Market Production Million Units (2018 – 2025)
9.5.6. South Korea
9.5.6.1. Technical Illustration Software Market Revenue $Million (2018 – 2025)
9.5.6.2. Technical Illustration Software Market Consumption Million Units (2018 – 2025)
9.5.6.3. Technical Illustration Software Market Production Million Units (2018 – 2025)
9.5.7. Rest of APAC
9.5.7.1. Technical Illustration Software Market Revenue $Million (2018 – 2025)
9.5.7.2. Technical Illustration Software Market Consumption Million Units (2018 – 2025)
9.5.7.3. Technical Illustration Software Market Production Million Units (2018 – 2025)
9.6. REST OF THE WORLD
9.6.1. Current Trends and Future Prospects
9.6.2. Europe market revenue, sales and production volume, 2018 – 2025
9.6.3. Latin America
9.6.3.1. Technical Illustration Software Market Revenue $Million (2018 – 2025)
9.6.3.2. Technical Illustration Software Market Consumption Million Units (2018 – 2025)
9.6.3.3. Technical Illustration Software Market Production Million Units (2018 – 2025)
9.6.4. Middle East
9.6.4.1. Technical Illustration Software Market Revenue $Million (2018 – 2025)
9.6.4.2. Technical Illustration Software Market Consumption Million Units (2018 – 2025)
9.6.4.3. Technical Illustration Software Market Production Million Units (2018 – 2025)
9.6.5. Africa
9.6.5.1. Technical Illustration Software Market Revenue $Million (2018 – 2025)
9.6.5.2. Technical Illustration Software Market Consumption Million Units (2018 – 2025)
9.6.5.3. Technical Illustration Software Market Production Million Units (2018 – 2025)
CHAPTER 10. KEY VENDOR PROFILES
10.1. Autodesk Incorporated
10.1.1. Company overview
10.1.2. Portfolio Analysis
10.1.3. Estimated revenue from technical illustration software business and market share
10.1.4. Regional & business segment Revenue Analysis
10.2. Dassault Systems
10.2.1. Company overview
10.2.2. Portfolio Analysis
10.2.3. Estimated revenue from technical illustration software business and market share
10.2.4. Regional & business segment Revenue Analysis
10.3. Canvas GFX Incorporated
10.3.1. Company overview
10.3.2. Portfolio Analysis
10.3.3. Estimated revenue from technical illustration software business and market share
10.3.4. Regional & business segment Revenue Analysis
10.4. Corel Corporation
10.4.1. Company overview
10.4.2. Portfolio Analysis
10.4.3. Estimated revenue from technical illustration software business and market share
10.4.4. Regional & business segment Revenue Analysis
10.5. PTC Incorporated
10.5.1. Company overview
10.5.2. Portfolio Analysis
10.5.3. Estimated revenue from technical illustration software business and market share
10.5.4. Regional & business segment Revenue Analysis
10.6. Siemens Product Lifecycle Management Software Inc.
10.6.1. Company overview
10.6.2. Portfolio Analysis
10.6.3. Estimated revenue from technical illustration software business and market share
10.6.4. Regional & business segment Revenue Analysis
10.7. Cyient
10.7.1. Company overview
10.7.2. Portfolio Analysis
10.7.3. Estimated revenue from technical illustration software business and market share
10.7.4. Regional & business segment Revenue Analysis
10.8. QuadriSpace Corporation
10.8.1. Company overview
10.8.2. Portfolio Analysis
10.8.3. Estimated revenue from technical illustration software business and market share
10.8.4. Regional & business segment Revenue Analysis
10.9. Auto-Trol Technology Corporation
10.9.1. Company overview
10.9.2. Portfolio Analysis
10.9.3. Estimated revenue from technical illustration software business and market share
10.9.4. Regional & business segment Revenue Analysis
PURCHASE OPTIONS
20% Free Customization ON ALL PURCHASE
*Terms & Conditions Apply
Looking for report on this market in a particular region or country? Get In Touch
Request Free Sample
Please fill in the form below to Request for free Sample Report
-
Office Hours Mon - Sat 10:00 - 16:00
-
Call Us +91 6201075429
-
Send Us Mail sales@marketdecipher.com
Market Decipher is a market research and consultancy firm involved in provision of market reports to organisations of varied sizes; small, large and medium.

© 2018 Market Decipher. All Rights Reserved