Test Strips Market
By Product (Diabetes Test Strips {Thick-film, Thin-film}, Urine Test Strips), By End-use (Hospitals, Home Care, Diagnostic Laboratories), Industry Analysis Report, Regional Outlook (U.S., Canada, Germany, UK, France, Spain, Italy, Russia, Japan, China, India, Australia, Argentina, Brazil, Mexico, South Africa, Saudi Arabia, UAE, Kuwait)
- Report ID : MD1457 |
- Pages : 240 |
- Tables : 85 |
- Formats :


Test strips are the medium upon which glucose testing and urinalysis are conducted. They provide the ease of performing a test for a patient from the comfort of one’s home. It is pretty straightforward to use and doesn’t need the presence of a medical professional.
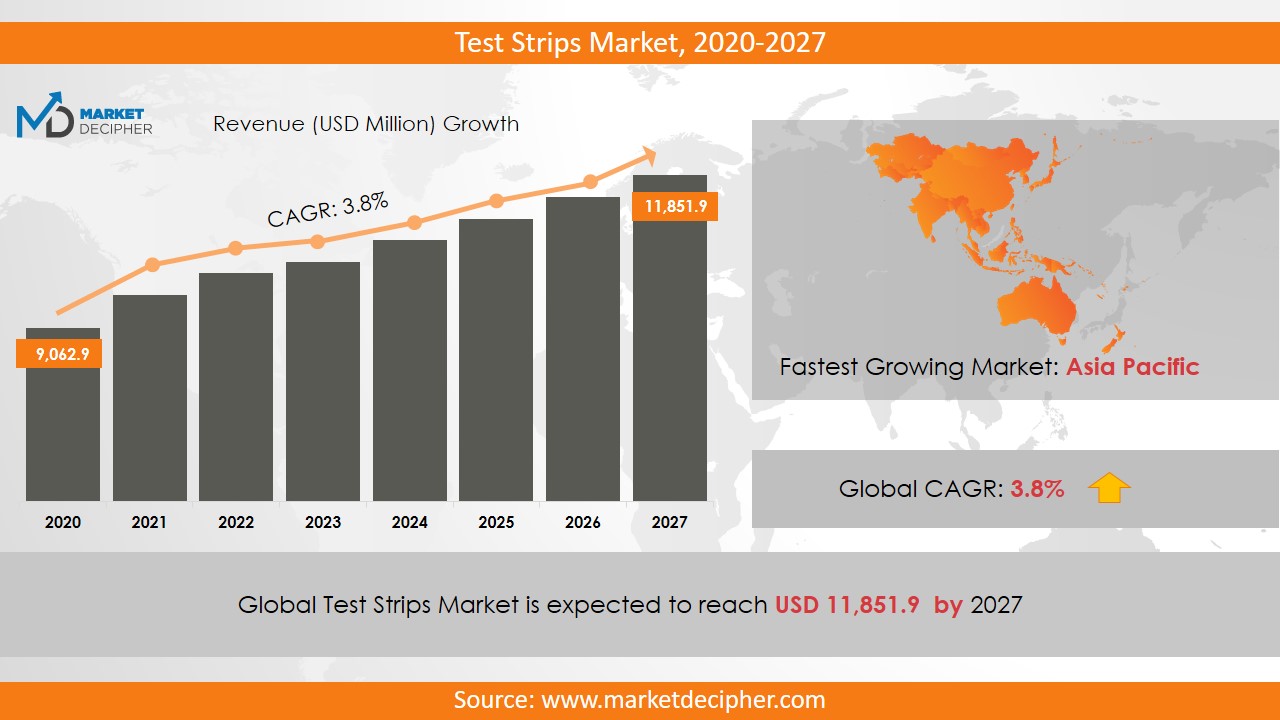
Test Strips Market size was estimated at $9,266.1 Million in 2022 and is expected to reach $12,030.3 Million by 2031, growing at a CAGR of 3.8% during the forecast period of 2022 to 2031.
Analysis by Product
According to the product, the two main segments are Diabetes Test Strips and Urine Test Strips. The former is further classified into thin-film and thick-film test strips.
The Diabetes test strips have the lion’s share of the market and their dominance will continue in the forecasted period. The simple reason behind this massive imbalance is the rising number of diabetes, especially in the U.S. This is further accentuated by the sedentary lifestyle of a significant population and unhealthy food habits.
The Urine test strips have a specific function in special circumstances. They are used in kidney malfunctions and infections in the urinary tract. Studies have shown that an increment in alcohol intake is one of the leading causes of these issues. Besides, this pattern is on the rise and thus the manufacturers in this space will witness stable growth in the demand of test strips.
Analysis by End-use
According to end-use, the segmentation is as follows: Hospitals, Home Care, and Diagnostic Laboratories.
Hospitals account for a massive market share for test strips owing to newfound ways of diagnosis for various lifestyle diseases such as Diabetes. Also, the healthcare infrastructure and availability of qualified medical professionals is on the rise. Even developing countries are starting to focus on robust medical utilities. This will further increment the demand for the leading companies in this industry and provide their investors with a good return for their investment.
Another segment on the move is that of Home Care. The rise in the number of pharmacies and self-explanatory test strips will boost this segment’s growth to new heights in the forecasted time. E-commerce platforms are another growing distribution channel for these products and customers are taking quite a liking for them.
Analysis by Region
The United States of America is witnessing a large influx of test strip manufacturers owing to a rising incidence of diabetes in the population. The manufacturers feel very secure in being associated with the US market as the healthcare infrastructure is robust and thereby, so are their revenues.
China and India have the largest number of diabetes patients in the world by number. Although the US has a larger percentage of the population with diabetes, it is the sheer gigantic number of people in these two countries that make them go past the US. Thus, the South Asia region will fast become a demand hotspot for the various manufacturers in this industry. The trade volumes are expected to escalate at a rapid pace. On a separate note, obesity also leads to a risk of diabetes.
Analysis by Leading Organizations
Some of the world’s best companies in this space are Roche, Abbott, Lifescan, Bayer, B Braun, Siemens, Arkray, Henry Schein, and Tiadoc.
The primary goal of most of these firms will be to support the existing infrastructure to improve the throughput. Strategic innovators and consultants are the need of the hour for streamlining their operational capabilities so that more finished goods can be manufactured without putting a dent on the fixed capital.
In some cases, mergers and acquisitions result in a better grasp of a particular geography. This is because certain regional players already have a hold and understanding of the region in which they are established. This results in good business synergies.
COVERAGE HIGHLIGHTS
● Market Revenue Estimation and Forecast (2022 – 2031)
● Market Production Estimation and Forecast (2022 – 2031)
● Market Sales/Consumption Volume Estimation and Forecast (2022 – 2031)
● Breakdown of Revenue by Segments (2022 – 2031)
● Breakdown of Production by Segments (2022 – 2031)
● Breakdown of Sales Volume by Segments (2022 – 2031)
● Gross Margin and Profitability Analysis of Companies
● Business Trend and Expansion Analysis
● Import and Export Analysis
● Regional Analysis and Market Data Breakdown
MARKET SEGMENTATION
By Product Outlook ($Revenue and Unit Sales, 2022-2031)
• Diabetes Test Strips
o Thick-film
o Thin-film
• Urine Test Strips
By End-use Material Outlook ($Revenue and Unit Sales, 2022-2031)
• Hospitals
• Home Care
• Diagnostic Laboratories
By Regional Outlook ($Revenue and Unit Sales, 2022-2031)
• U.S.
• Canada
• Germany
• UK
• France
• Spain
• Italy
• Russia
• Japan
• China
• India
• Australia
• Argentina
• Brazil
• Mexico
• South Africa
• Saudi Arabia
• UAE
• Kuwait
Leading Organizations
• Abbott
• Acon Lab
• Ascensia
• Arkray
• B. Braun
• Henry Schein
• Lifescan
• Roche Holding AG
• Siemens
• Tiadoc
Need Report on a particular Country OR need a Tailored/Customized Research? Budget Limits/Price Discounts Query...!
Email to David Correa
OR Fill the below "Sample Request FORM" with your queries in the message box.
CHAPTER 1: INTRODUCTION
1.1. RESEARCH METHODOLOGY
1.1.1. Desk Research
1.1.2. Data Synthesis
1.1.3. Data Validation & Market Feedback
1.1.4. Data Sources
CHAPTER 2: EXECUTIVE SUMMARY
2.1. GLOBAL MARKET OUTLOOK
2.2. CORE INSIGHTS –DELIVERY MODEL
2.3. CORE INSIGHTS – TEST STRIPS
2.4. CORE INSIGHTS – SERVICE PROVIDER
2.5. CORE INSIGHTS – GEOGRAPHY
CHAPTER 3: MARKET OVERVIEW
3.1. MARKET DEFINITION AND SCOPE
3.2. KEY FORCES SHAPING THE INDUSTRY
3.2.1. Bargaining Power of Suppliers
3.2.2. Bargaining Power of Buyers
3.2.3. Threat of Substitutes
3.2.4. Threat of New Entrants
3.3. MARKET DYNAMICS
3.3.1. Drivers
3.3.1.1. Supply-side Drivers
3.3.1.2. Demand-side Drivers
3.3.2. Restraints
3.3.3. Opportunities
3.4. INDUSTRY - ANALYSIS
3.4.1. Political Market
3.4.2. Environmental Market
3.4.3. Social Market
3.4.4. Technology Market
CHAPTER 4: MARKET BACKGROUND
4.1. Industry Value Chain Analysis
4.1.1. Upstream Participants
4.1.2. Downstream participants
4.2. Pricing Analysis and Forecast, 2019-2026
4.2.1. By Type
4.2.2. By Region
CHAPTER 5: TEST STRIPS MARKET, BY PRODUCT OUTLOOK
5.1. Overview
5.1.1. Market Revenue (US$ Million) and Forecast, 2019-2026
5.2. Diabetes Test Strips
5.2.1. Key Market Trends, Growth Factors and Opportunities
5.2.2. Market Revenue (US$ Million) and Forecast, By Region
5.3. Thick-film
5.3.1. Key Market Trends, Growth Factors and Opportunities
5.3.2. Market Revenue (US$ Million) and Forecast, By Region
5.4. Thin-film
5.4.1. Key Market Trends, Growth Factors and Opportunities
5.4.2. Market Revenue (US$ Million) and Forecast, By Region
5.5. Urine Test Strips
5.5.1. Key Market Trends, Growth Factors and Opportunities
5.5.2. Market Revenue (US$ Million) and Forecast, By Region
CHAPTER 6: TEST STRIPS MARKET BYEND-USE MATERIAL OUTLOOK
6.1. Overview
6.1.1. Market Revenue (US$ Million) and Forecast, 2019-2026
6.2. Hospitals
6.2.1. Key Market Trends, Growth Factors and Opportunities
6.2.2. Market Revenue (US$ Million) and Forecast, By Region
6.3. Home Care
6.3.1. Key Market Trends, Growth Factors and Opportunities
6.3.2. Market Revenue (US$ Million) and Forecast, By Region
6.4. Diagnostic Laboratories
6.4.1. Key Market Trends, Growth Factors and Opportunities
6.4.2. Market Revenue (US$ Million) and Forecast, By Region
CHAPTER 7: TEST STRIPS MARKET, BY GEOGRAPHY
7.1. Overview
7.2. North America
7.2.1. Key Market Trends, Growth Factors and Opportunities
7.2.2. Market Revenue and Forecast, By Delivery Model
7.2.3. Market Revenue and Forecast, By Agriculture Type
7.2.4. Market Revenue and Forecast, By Service Provider
7.2.5. Market Revenue and Forecast, By Country
7.2.6. U.S.
7.2.6.1. Market Revenue and Forecast
7.2.7. Canada
7.2.7.1. Market Revenue and Forecast
7.2.8. Mexico
7.2.8.1. Market Revenue and Forecast
7.3. Europe
7.3.1. Market Revenue and Forecast, By Delivery Model
7.3.2. Market Revenue and Forecast, By Agriculture Type
7.3.3. Market Revenue and Forecast, By Service Provider
7.3.4. Market Revenue and Forecast, By Country
7.3.5. Germany
7.3.5.1. Market Revenue and Forecast
7.3.6. UK
7.3.6.1. Market Revenue and Forecast
7.3.7. France
7.3.7.1. Market Revenue and Forecast
7.3.8. Italy
7.3.8.1. Market Revenue and Forecast
7.3.9. Spain
7.3.9.1. Market Revenue and Forecast
7.3.10. Poland
7.3.10.1. Market Revenue and Forecast
7.3.11. Austrai
7.3.11.1. Market Revenue and Forecast
7.3.12. Luxembourg
7.3.12.1. Market Revenue and Forecast
7.3.13. Rest of Europe
7.3.13.1. Market Revenue and Forecast
7.4. Asia-Pacific
7.4.1. Market Revenue and Forecast, By Delivery Model
7.4.2. Market Revenue and Forecast, By Agriculture Type
7.4.3. Market Revenue and Forecast, By Service Provider
7.4.4. Market Revenue and Forecast, By Country
7.4.5. China
7.4.5.1. Market Revenue and Forecast
7.4.6. India
7.4.6.1. Market Revenue and Forecast
7.4.7. Japan
7.4.7.1. Market Revenue and Forecast
7.4.8. South Korea
7.4.8.1. Market Revenue and Forecast
7.4.9. Rest of APAC
7.4.9.1. Market Revenue and Forecast
7.5. REST OF THE WORLD
7.5.1. Market Revenue and Forecast, By Delivery Model
7.5.2. Market Revenue and Forecast, By Agriculture Type
7.5.3. Market Revenue and Forecast, By Service Provider
7.5.4. Market Revenue and Forecast, By Country
7.5.5. Latin America
7.5.5.1. Market Revenue and Forecast
7.5.6. Middle East
7.5.6.1. Market Revenue and Forecast
7.5.7. Africa
7.5.7.1. Market Revenue and Forecast
CHAPTER 8: COMPANY PROFILES
8.1. Airbus S.A.S
8.1.1. Company Overview
8.1.2. Financial Performance
8.1.3. SWOT Analysis
8.2. Aviation Industry Corporation of China Ltd. (AVIC)
8.2.1. Company Overview
8.2.2. Financial Performance
8.2.3. SWOT Analysis
8.3. Astronics Corporation
8.3.1. Company Overview
8.3.2. Financial Performance
8.3.3. SWOT Analysis
8.4. Boeing
8.4.1. Company Overview
8.4.2. Financial Performance
8.4.3. SWOT Analysis
8.5. Ball Corporation
8.5.1. Company Overview
8.5.2. Financial Performance
8.5.3. SWOT Analysis
8.6. BAE Systems
8.6.1. Company Overview
8.6.2. Financial Performance
8.6.3. SWOT Analysis
8.7. Cobham plc
8.7.1. Company Overview
8.7.2. Financial Performance
8.7.3. SWOT Analysis
8.8. Curtiss Wright
8.8.1. Company Overview
8.8.2. Financial Performance
8.8.3. SWOT Analysis
8.9. Elbit System
8.9.1. Company Overview
8.9.2. Financial Performance
8.9.3. SWOT Analysis
8.10. Gramin Ltd
8.10.1. Company Overview
8.10.2. Financial Performance
8.10.3. SWOT Analysis
8.11. GE Aviation
8.11.1. Company Overview
8.11.2. Financial Performance
8.11.3. SWOT Analysis
8.12. Harris Corporation
8.12.1. Company Overview
8.12.2. Financial Performance
8.12.3. SWOT Analysis
8.13. Honeywell International Inc.
8.13.1. Company Overview
8.13.2. Financial Performance
8.13.3. SWOT Analysis
8.14. Lockheed Martin Corporation
8.14.1. Company Overview
8.14.2. Financial Performance
8.14.3. SWOT Analysis
8.15. L3 Harris Corporation
8.15.1. Company Overview
8.15.2. Financial Performance
8.15.3. SWOT Analysis
8.16. Meggitt PLC
8.16.1. Company Overview
8.16.2. Financial Performance
8.16.3. SWOT Analysis
8.17. Northrop Grumman Corporation
8.17.1. Company Overview
8.17.2. Financial Performance
8.17.3. SWOT Analysis
8.18. Nucon Aerospace
8.18.1. Company Overview
8.18.2. Financial Performance
8.18.3. SWOT Analysis
8.19. Panasonic Corporation
8.19.1. Company Overview
8.19.2. Financial Performance
8.19.3. SWOT Analysis
8.20. Rolls Royce
8.20.1. Company Overview
8.20.2. Financial Performance
8.20.3. SWOT Analysis
8.21. Raytheon Company
8.21.1. Company Overview
8.21.2. Financial Performance
8.21.3. SWOT Analysis
8.22. Saab AB
8.22.1. Company Overview
8.22.2. Financial Performance
8.22.3. SWOT Analysis
8.23. Safran
8.23.1. Company Overview
8.23.2. Financial Performance
8.23.3. SWOT Analysis
8.24. Thales Group
8.24.1. Company Overview
8.24.2. Financial Performance
8.24.3. SWOT Analysis
8.25. Teledyne Technologies Inc.
8.25.1. Company Overview
8.25.2. Financial Performance
8.25.3. SWOT Analysis
8.26. Transdigm Group Inc.
8.26.1. Company Overview
8.26.2. Financial Performance
8.26.3. SWOT Analysis
PURCHASE OPTIONS
20% Free Customization ON ALL PURCHASE
*Terms & Conditions Apply
Looking for report on this market in a particular region or country? Get In Touch
Request Free Sample
Please fill in the form below to Request for free Sample Report
-
Office Hours Mon - Sat 10:00 - 16:00
-
Call Us +91 6201075429
-
Send Us Mail sales@marketdecipher.com
Market Decipher is a market research and consultancy firm involved in provision of market reports to organisations of varied sizes; small, large and medium.

© 2018 Market Decipher. All Rights Reserved