Touch Screen Display Market Revenue, Sales Volume & Trend Forecast Report, 2019-2026
By Screen Type (Resistive, Surface acoustic wave type and Capacitive and Infrared), By Application (Tablets, Consumer Electronics, Smartphone, and Professional application), By Region (North America, Europe, APAC and Rest of the World)
- Report ID : MD1034 |
- Pages : 188 |
- Tables : 86 |
- Formats :


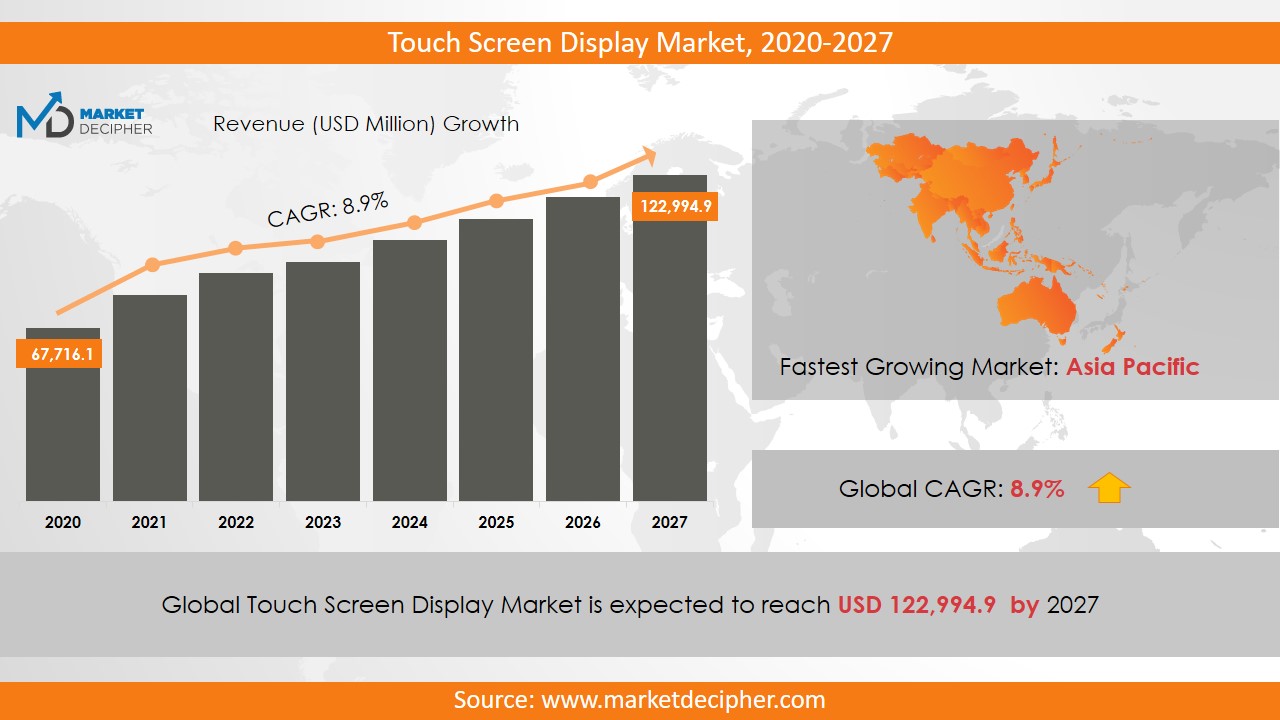
Touch Screen Display market revenue shall reach a value of $101.6 Billion in 2026, growing with a CAGR of 9.1% during the forecast period of 2018 to 2026. In terms of volume sales, the market is anticipated to reach XX Units.
Increasing use of electronic gadgets such as tablets and Smartphone is anticipated to increase the touch screen display market size. Further, these displays are used in various products such as laptops, personal computers, etc. The ongoing improvements and advancements in this technology have resulted in the introduction of scratchless and the touch screens which are multi-touch sensitive. Further, the features such as infrared touch screen and gesture sensing are attracting the consumer’s attention to investing in the technology and thereby supporting the touch screen display market growth.
Depleting raw materials used in this technology acts as the major restraint in touch screen display market growth. The high cost of the display and heavy competition among market players may lead to a decline in the touch screen display market sales. However, the advancements in the hardware technology are expected to increase the demand for Touch screen displays and thereby contributing to the industry growth significantly. Applications of these displays have extended to DVD, television and automotive sector in recent years.
REGIONAL ANALYSIS
The North American region dominated market revenue in 2018 and is expected to continue this trend during the forecast period due to the high demand for better and higher resolution picture quality among consumers. Also, the high utilization of high-tech equipment in this area contributes to the development of the market. This region has accounted to hold the largest share of the market in 2018. The Asia Pacific region is also anticipated to witness high growth in the coming few years as there is an extraordinary demand for Smartphones and the easy availability of raw materials in this region.
SEGMENT ANALYSIS
In terms of screen type, the segmentation has been done as Resistive, Surface acoustic wave type and Capacitive and Infrared. By application, the market has been segmented as Tablets, Consumer Electronics, Smartphone, and Professional applications. Healthcare, education, kiosks, retails and the government is the professional where these displays are being used.
INDUSTRY PLAYER ANALYSIS
Major industry players have been analyzed with coverage on their operating areas, revenues, and other strategic aspects. These industry players include Corning Incorporated, Fujitsu Limited, 3M Company, Atmel Corporation, Microsoft Corporation, DISPLAX Interactive Systems, Cypress Semiconductor Corporation, Fujitsu Limited, LG Display, Samsung, Microsoft Corporation, Wintek Corporation, Synaptic Incorporated, Free scale Gigabyte, and LG Display.
COVERAGE HIGHLIGHTS
• Revenue Estimation and Forecast (2018 – 2026)
• Production Estimation and Forecast (2018 – 2026)
• Sales/Consumption Volume Estimation and Forecast (2018 – 2026)
• Breakdown of Revenue by Segments (2018 – 2026)
• Breakdown of Production by Segments (2018 – 2026)
• Breakdown of Sales Volume by Segments (2018 – 2026)
• Gross Margin and Profitability Analysis of Companies
• Business Trend and Expansion Analysis
• Import and Export Analysis
• Regional Analysis and Data Breakdown
SEGMENTAL ANALYSIS:
By Screen type ($Revenue and Unit Sales, 2018-2026)
• Resistive
• Surface acoustic wave type
• Capacitive and Infrared
By Application ($Revenue and Unit Sales, 2018-2026)
• Tablets
• Consumer Electronics
• Smartphone
• Professional application
By Region ($Revenue and Unit Sales, 2018-2026)
• North America
• Mexico
• U.S
• Canada
• Europe
• France
• U.K
• Germany
• Russia
• Italy
• Rest of Europe
• Asia-Pacific
• South Korea
• India
• Japan
• China
• Rest of Asia-Pacific
• Rest of the World
• Middle East
• Africa
• Latin America
CHAPTER 1. INTRODUCTION
1.1. RESEARCH METHODOLOGY
1.1.1. Data Collection
1.1.2. Data Modeling
1.1.3. Historical Revenue and Sales Estimation
1.1.4. Data Triangulation
1.2. RESEARCH PROCESS
1.2.1. Primary Research
1.2.2. Secondary Research
1.2.3. Survey Data
1.2.4. Validation by In-House Expert
1.3. TOUCH SCREEN DISPLAY MARKET OVERVIEW
1.3.1. Research Scope and Market Definition
1.3.2. Executive Summary
CHAPTER 2. GLOBAL TOUCH SCREEN DISPLAY MARKET DEMAND SIDE ANALYSIS
2.1. TOUCH SCREEN DISPLAY MARKET CONSUMPTION VOLUME (BILLION UNITS), 2018 – 2025
2.2. MARKET CONSUMPTION VOLUME SPLIT BY REGION (BILLION UNITS), 2018 – 2025
2.3. MARKET CONSUMPTION VOLUME SPLIT BY COUNTRIES (BILLION UNITS), 2018 – 2025
2.4. MARKET REVENUE (BILLION USD), 2018-2025
2.5. MARKET REVENUE SPLIT BY REGION (BILLION UNITS), 2018 – 2025
2.6. TOUCH SCREEN DISPLAY MARKET REVENUE SPLIT BY COUNTRIES (BILLION UNITS), 2018 – 2025
CHAPTER 3. GLOBAL TOUCH SCREEN DISPLAY MARKET SUPPLY SIDE ANALYSIS
3.1. TOUCH SCREEN DISPLAY MARKET PRODUCTION VOLUME (BILLION UNITS), 2018 – 2025
3.2. MARKET PRODUCTION VOLUME SPLIT BY REGION (BILLION UNITS), 2018-2025
3.3. MARKET PRODUCTION VOLUME SPLIT/RANKING BY COUNTRIES (BILLION UNITS), 2018 – 2025
CHAPTER 4. GLOBAL TOUCH SCREEN DISPLAY MARKET COMPETITIVE SCENARIO & BUSINESS OPPORTUNITY ANALYSIS
4.1. COMPETITIVE STRENGTH RANKING BY MAJOR COUNTRIES, 2018
4.2. MARKET ATTRACTIVENESS RANKING BY MAJOR COUNTRIES, 2018 - 2025
4.3. EMERGING BUSINESS OPPORTUNITIES AND GROWTH PROSPECTS
4.3.1. Growth Drivers
4.3.2. Market Restraints
4.3.2. Opportunities
CHAPTER 5. GLOBAL TOUCH SCREEN DISPLAY MARKET ENTRY STRATEGIES
5.1. ENTRY STRATEGIES IN DEVELOPING MARKETS
5.2. ENTRY STRATEGIES IN DEVELOPED MARKETS
CHAPTER 6. GLOBAL TOUCH SCREEN DISPLAY MARKET BY SCREEN TYPE
6.1. SEGMENT OUTLINE
6.2. REVENUE SHARE BY SCREEN TYPE, $BILLION, 2018 – 2025
6.2. CONSUMPTION SHARE BY SCREEN TYPE, BILLION UNITS, 2018 - 2025
6.3. PRODUCTION SHARE BY SCREEN TYPE, BILLION UNITS, 2018 – 2025
6.4. RESISTIVE
6.4.1. Market determinants and trend analysis
6.4.2. Market revenue, sales and production volume, 2018 – 2025
6.5. SURFACE ACOUSTIC WAVE TYPE
6.5.1. Market determinants and trend analysis
6.5.2. Market revenue, sales and production volume, 2018 – 2025
6.6. CAPACITIVE AND INFRARED
6.6.1. Market determinants and trend analysis
6.6.2. Market revenue, sales and production volume, 2018 – 2025
CHAPTER 7. GLOBAL TOUCH SCREEN DISPLAY MARKET BY APPLICATION
7.1. SEGMENT OUTLINE
7.2. REVENUE SHARE BY APPLICATION, $BILLION, 2018 – 2025
7.2. CONSUMPTION SHARE BY APPLICATION, BILLION UNITS, 2018 - 2025
7.3. PRODUCTION SHARE BY APPLICATION, BILLION UNITS, 2018 – 2025
7.4. TABLETS
7.4.1. Market determinants and trend analysis
7.4.2. Market revenue, sales and production volume, 2018 – 2025
7.5. CONSUMER ELECTRONICS
7.5.1. Market determinants and trend analysis
7.5.2. Market revenue, sales and production volume, 2018 – 2025
7.6. SMARTPHONE
7.6.1. Market determinants and trend analysis
7.6.2. Market revenue, sales and production volume, 2018 – 2025
7.7. PROFESSIONAL APPLICATION
7.7.1. Market determinants and trend analysis
7.7.2. Market revenue, sales and production volume, 2018 – 2025
CHAPTER 8. GLOBAL TOUCH SCREEN DISPLAY MARKET BY REGIONS
8.1. REGIONAL OUTLOOK
8.2. MARKET PRODUCTION, CONSUMPTION & REVENUE BY REGION, 2018-2025
8.3. NORTH AMERICA
8.3.1. Current Trends and Future Prospects
8.3.2. North America market revenue, sales and production volume, 2018 – 2025
8.3.3.U.S.
8.3.3.1. Touch Screen Display Market Revenue $BILLION (2018 – 2025)
8.3.3.2. Touch Screen Display Market Consumption BILLION Units (2018 – 2025)
8.3.3.3. Touch Screen Display Market Production BILLION Units (2018 – 2025)
8.3.4. Canada
8.3.4.1. Touch Screen Display Market Revenue $BILLION (2018 – 2025)
8.3.4.2. Touch Screen Display Market Consumption BILLION Units (2018 – 2025)
8.3.4.3. Touch Screen Display Market Production BILLION Units (2018 – 2025)
8.3.5. Mexico
8.3.5.1. Touch Screen Display Market Revenue $BILLION (2018 – 2025)
8.3.5.2. Touch Screen Display Market Consumption BILLION Units (2018 – 2025)
8.3.5.3. Touch Screen Display Market Production BILLION Units (2018 – 2025)
8.4. EUROPE
8.4.1. Current Trends and Future Prospects
8.4.2. Europe market revenue, sales and production volume, 2018 – 2025
8.4.3. U.K
8.4.3.1. Touch Screen Display Market Revenue $BILLION (2018 – 2025)
8.4.3.2. Touch Screen Display Market Consumption BILLION Units (2018 – 2025)
8.4.3.3. Touch Screen Display Market Production BILLION Units (2018 – 2025)
8.4.4. Germany
8.4.4.1. Touch Screen Display Market Revenue $BILLION (2018 – 2025)
8.4.4.2. Touch Screen Display Market Consumption BILLION Units (2018 – 2025)
8.4.4.3. Touch Screen Display Market Production BILLION Units (2018 – 2025)
8.4.5. France
8.4.5.1. Touch Screen Display Market Revenue $BILLION (2018 – 2025)
8.4.5.2. Touch Screen Display Market Consumption BILLION Units (2018 – 2025)
8.4.5.3. Touch Screen Display Market Production BILLION Units (2018 – 2025)
8.4.6. Italy
8.4.6.1. Touch Screen Display Market Revenue $BILLION (2018 – 2025)
8.4.6.2. Touch Screen Display Market Consumption BILLION Units (2018 – 2025)
8.4.6.3. Touch Screen Display Market Production BILLION Units (2018 – 2025)
8.4.7. Rest of Europe
8.4.7.1. Touch Screen Display Market Revenue $BILLION (2018 – 2025)
8.4.7.2. Touch Screen Display Market Consumption BILLION Units (2018 – 2025)
8.4.7.3. Touch Screen Display Market Production BILLION Units (2018 – 2025)
8.5. ASIA PACIFIC
8.5.1. Current Trends and Future Prospects
8.5.2. Europe market revenue, sales and production volume, 2018 – 2025
8.5.3. India
8.5.3.1. Touch Screen Display Market Revenue $BILLION (2018 – 2025)
8.5.3.2. Touch Screen Display Market Consumption BILLION Units (2018 – 2025)
8.5.3.3. Touch Screen Display Market Production BILLION Units (2018 – 2025)
8.5.4. Japan
8.5.4.1. Touch Screen Display Market Revenue $BILLION (2018 – 2025)
8.5.4.2. Touch Screen Display Market Consumption BILLION Units (2018 – 2025)
8.5.4.3. Touch Screen Display Market Production BILLION Units (2018 – 2025)
8.5.5. China
8.5.5.1. Touch Screen Display Market Revenue $BILLION (2018 – 2025)
8.5.5.2. Touch Screen Display Market Consumption BILLION Units (2018 – 2025)
8.5.5.3. Touch Screen Display Market Production BILLION Units (2018 – 2025)
8.5.6. South Korea
8.5.6.1. Touch Screen Display Market Revenue $BILLION (2018 – 2025)
8.5.6.2. Touch Screen Display Market Consumption BILLION Units (2018 – 2025)
8.5.6.3. Touch Screen Display Market Production BILLION Units (2018 – 2025)
8.5.7. Rest of APAC
8.5.7.1. Touch Screen Display Market Revenue $BILLION (2018 – 2025)
8.5.7.2. Touch Screen Display Market Consumption BILLION Units (2018 – 2025)
8.5.7.3. Touch Screen Display Market Production BILLION Units (2018 – 2025)
8.6. REST OF THE WORLD
8.6.1. Current Trends and Future Prospects
8.6.2. Europe market revenue, sales and production volume, 2018 – 2025
8.6.3. Latin America
8.6.3.1. Touch Screen Display Market Revenue $BILLION (2018 – 2025)
8.6.3.2. Touch Screen Display Market Consumption BILLION Units (2018 – 2025)
8.6.3.3. Touch Screen Display Market Production BILLION Units (2018 – 2025)
8.6.4. Middle East
8.6.4.1. Touch Screen Display Market Revenue $BILLION (2018 – 2025)
8.6.4.2. Touch Screen Display Market Consumption BILLION Units (2018 – 2025)
8.6.4.3. Touch Screen Display Market Production BILLION Units (2018 – 2025)
8.6.5. Africa
8.6.5.1. Touch Screen Display Market Revenue $BILLION (2018 – 2025)
8.6.5.2. Touch Screen Display Market Consumption BILLION Units (2018 – 2025)
8.6.5.3. Touch Screen Display Market Production BILLION Units (2018 – 2025)
CHAPTER 9. KEY VENDOR PROFILES
9.1. Corning Incorporated
9.1.1. Company overview
9.1.2. Portfolio Analysis
9.1.3. Estimated revenue from touch screen display business and market share
9.1.4. Regional & business segment Revenue Analysis
9.2. Fujitsu Limited
9.2.1. Company overview
9.2.2. Portfolio Analysis
9.2.3. Estimated revenue from touch screen display business and market share
9.2.4. Regional & business segment Revenue Analysis
9.3. 3M Company
9.3.1. Company overview
9.3.2. Portfolio Analysis
9.3.3. Estimated revenue from touch screen display business and market share
9.3.4. Regional & business segment Revenue Analysis
9.4. Atmel Corporation
9.4.1. Company overview
9.4.2. Portfolio Analysis
9.4.3. Estimated revenue from touch screen display business and market share
9.4.4. Regional & business segment Revenue Analysis
9.5. Microsoft Corporation
9.5.1. Company overview
9.5.2. Portfolio Analysis
9.5.3. Estimated revenue from touch screen display business and market share
9.5.4. Regional & business segment Revenue Analysis
9.6. DISPLAX Interactive Systems
9.6.1. Company overview
9.6.2. Portfolio Analysis
9.6.3. Estimated revenue from touch screen display business and market share
9.6.4. Regional & business segment Revenue Analysis
9.7. Cypress Semiconductor Corporation
9.7.1. Company overview
9.7.2. Portfolio Analysis
9.7.3. Estimated revenue from touch screen display business and market share
9.7.4. Regional & business segment Revenue Analysis
9.8. Fujitsu Limited
9.8.1. Company overview
9.8.2. Portfolio Analysis
9.8.3. Estimated revenue from touch screen display business and market share
9.8.4. Regional & business segment Revenue Analysis
9.9. LG Display
9.9.1. Company overview
9.9.2. Portfolio Analysis
9.9.3. Estimated revenue from touch screen display business and market share
9.9.4. Regional & business segment Revenue Analysis
9.10. Samsung
9.10.1. Company overview
9.10.2. Portfolio Analysis
9.10.3. Estimated revenue from touch screen display business and market share
9.10.4. Regional & business segment Revenue Analysis
9.11. Microsoft Corporation
9.11.1. Company overview
9.11.2. Portfolio Analysis
9.11.3. Estimated revenue from touch screen display business and market share
9.11.4. Regional & business segment Revenue Analysis
9.12. Wintek Corporation
9.12.1. Company overview
9.12.2. Portfolio Analysis
9.12.3. Estimated revenue from touch screen display business and market share
9.12.4. Regional & business segment Revenue Analysis
9.13. Synaptic Incorporated
9.13.1. Company overview
9.13.2. Portfolio Analysis
9.13.3. Estimated revenue from touch screen display business and market share
9.13.4. Regional & business segment Revenue Analysis
9.14. Free scale Gigabyte
9.14.1. Company overview
9.14.2. Portfolio Analysis
9.14.3. Estimated revenue from touch screen display business and market share
9.14.4. Regional & business segment Revenue Analysis
9.15. LG Display
9.15.1. Company overview
9.15.2. Portfolio Analysis
9.15.3. Estimated revenue from touch screen display business and market share
9.15.4. Regional & business segment Revenue Analysis
PURCHASE OPTIONS
20% Free Customization ON ALL PURCHASE
*Terms & Conditions Apply
Looking for report on this market in a particular region or country? Get In Touch
Request Free Sample
Please fill in the form below to Request for free Sample Report
-
Office Hours Mon - Sat 10:00 - 16:00
-
Call Us +91 6201075429
-
Send Us Mail sales@marketdecipher.com
Market Decipher is a market research and consultancy firm involved in provision of market reports to organisations of varied sizes; small, large and medium.

© 2018 Market Decipher. All Rights Reserved