Transportation Market Report 2019 – 2026, Sales Volume, Revenue, Growth Trend and Estimation Forecast
By Service (Professional, and Business), By End-Use Industries (Consumer goods, Healthcare, Pharmaceuticals, Automotive, Aerospace and defense), By Region (North America, Europe, APAC and Rest of the World)
- Report ID : MD1213 |
- Pages : 199 |
- Tables : 96 |
- Formats :


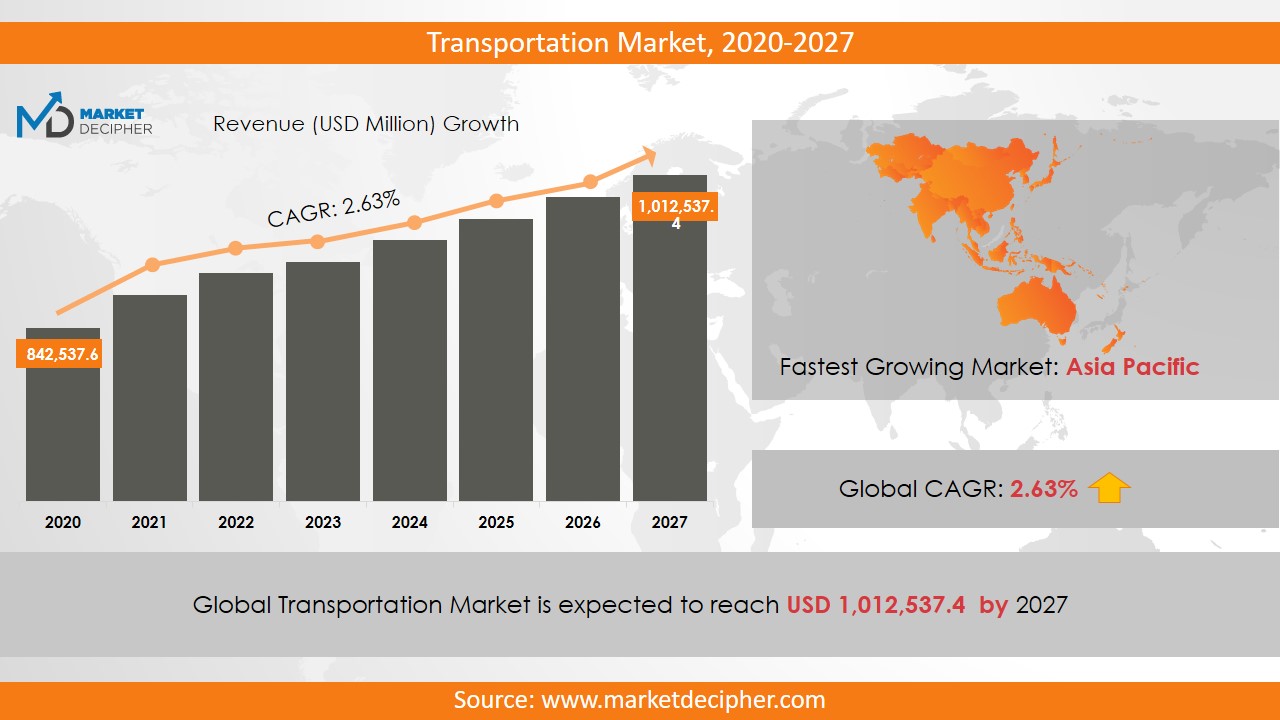
Transportation Market Revenue shall reach value of $XX.X Billion in 2026, growing with a CAGR of X.X% during the forecast period of 2018 to 2026. In terms of volume sales, the market is anticipated to reach XX Units.
Rapid urbanization owing to the increasing global population is leading to a significant increase in congestion and road safety concerns. Further, the transportation market growth is driven by the ongoing innovations in transport infrastructure. Transportation industry majorly includes the aviation, aerospace, automotive, rail transport, maritime, rail transport and road transport. According to a recent transportation market research report the strict government initiatives play a vital role in the market growth. For instance, EU Directives on IPS implemented on July 2010 was one such action taken by the government to manage road traffic. However, increasing passenger safety concerns may emerge as a major hurdle for the market growth.
Increasing demand for connected devices and connected vehicles is expected to increase the transportation market sales during the forecast period. Over the years, the top factors influencing the transportation market trends negatively are traffic congestion, GHG emission, air pollution and high fuel prices. The ideal transportation system is the only solution for all these problems. Ongoing technological development will lead to the introduction of driverless commercial vehicles across the world. Owing to the increased trend of online shopping, the commercial sector will drive the industry shares.
REGIONAL ANALYSIS
Europe has emerged as the dominant region in generating the transportation business revenue. As per the recent studies, it is estimated that at the end of forecast period, 233 million connected cars will be running on the roads of Europe. Increasing urbanization in the developing Asian countries such as China and India is leading to a complexities in the transportation requirements which may pose a daunting challenge in the market growth. Further, the high investment and increasing smart city projects in Asia Pacific region, is responsible for the growth of this region at considerable rate.
SEGMENTAL ANALYSIS
Based on service, the transportation industry has been segmented as professional and business. With the rapid development of manufacturing industries, the transportation business is witnessing a significant upsurge in its revenue from professional sector. With the increasing prevalence of hazardous diseases, the pharmaceutical industries will provide lucrative opportunities to the market in future. The consumer goods segment are expected to garner considerable revenue during the forecast period.
US garnered an industry revenue of $87 million owing to the high demand of transportation facilities in industrial sector. Firms and manufacturing industries spent a lot in the business size. Further, water transportation hold about 70% share of the overall revenue generated by US transportation business. As per the recent studies, trucking Associations registered a revenue of about $676.5 in 2016. Solely FedEx has emerged as the leading freight transportation industry and accounted for a market revenue of $60 million.
INDUSTRY PLAYER ANALYSIS
Prominent industry players investing heavily in the transportation market are Exel, DHL Danzas, Aramex, TNT, BlueDart and DTDC Worldwide Express. Others involved in packing and moving are Balmer Lawrie, Gati Transport, Safeexpress, TNT (Speedage), Container Corporation of India (CONCOR) and Associated Road Carriers Ltd. Tremendous growth in the market sales refelcts the winning strategies adopted by these industry players. It is estimated that, in Singapore the trend of driverless buses will go wild during the forecast period. At present, driverless vehicles are comprehensively used at Nanyang Technological University of Singapore. Further, North American region will dominate in adopting advanced transport technologies in coming five years.
COVERAGE HIGHLIGHTS
• Revenue Estimation and Forecast (2018 – 2026)
• Production Estimation and Forecast (2018 – 2026)
• Breakdown of Revenue by Segments (2018 – 2026)
• Breakdown of Production by Segments (2018 – 2026)
• Gross Margin and Profitability Analysis of Companies
• Business Trend and Expansion Analysis
• Import and Export Analysis
• Regional Analysis and Data Breakdown
SEGMENTAL ANALYSIS
By Service Outlook ($Revenue, 2018-2026)
• Professional
• Business
By Organisation Size Outlook ($Revenue, 2018-2026)
• Professional
• Business
By End-/Use Industries Outlook ($Revenue, 2018-2026)
• Consumer goods
• Healthcare
• Pharmaceuticals
• Food and beverages
• Automotive
• Aerospace and defense
By Regional Outlook ($Revenue, 2018-2026)
• North America
• Canada
• U.S
• Mexico
• Europe
• Germany
• U.K
• France
• Netherlands
• Austria
• Rest of Europe
• Asia-Pacific
• China
• India
• Japan
• South Korea
• Australia
• Rest of Asia Pacific
• The Middle East and Africa
• Saudi Arabia
• United Arab Emirates
• Rest of Middle East
• Africa
• South America
• Brazil
• Argentina
• Rest of South America
TRANSPORTATION COMPANIES:
• Exel
• DHL Danzas
• Aramex
• SemiCorp Logistics
• TNT
• BlueDart
• DTDC Worldwide Express
• Others
• Balmer Lawrie
• Gati Transport
• Safeexpress
• TNT (Speedage)
• Container Corporation of India (CONCOR)
• Associated Road Carriers Ltd
CHAPTER 1: INTRODUCTION
1.1. Research Methodology
1.1.1. Desk Research
1.1.2. Data Synthesis
1.1.3. Data Validation & Market Feedback
1.1.4. Data Sources
CHAPTER 2: EXECUTIVE SUMMARY
2.1. Global Market Outlook
2.2. Core Insights - Service
2.3. Core Insights – Organization
2.4. Core Insights – End-Use
2.5. Core Insights – Geography
CHAPTER 3: MARKET OVERVIEW
3.1. Market Definition and Scope
3.2. Key Forces Shaping the Industry
3.2.1. Bargaining Power of Suppliers
3.2.2. Bargaining Power of Buyers
3.2.3. Threat of Substitutes
3.2.4. Threat of New Entrants
3.3. Market Dynamics
3.3.1. Drivers
3.3.1.1. Supply-side Drivers
3.3.1.2. Demand-side Drivers
3.3.2. Restraints
3.3.3. Opportunities
3.4. Industry Landscape - PESTEL Analysis
3.4.1. Political Landscape
3.4.2. Environmental Landscape
3.4.3. Social Landscape
3.4.4. Technology Landscape
3.4.5. Economic Landscape
CHAPTER 4: MARKET BACKGROUND
4.1. Industry Value Chain Analysis
4.1.1. Upstream Participants
4.1.2. Downstream participants
4.2. Pricing Analysis and Forecast, 2018-2026
4.2.1. By Type
4.2.2. By Region
CHAPTER 5: GLOBAL TRANSPORTATION MARKET, BY SERVICE
5.1. Overview
5.1.1. Market Volume and Forecast, 2018-2026
5.1.2. Market Revenue (US$ Million) and Forecast, 2018-2026
5.2. Professional
5.2.1. Key Market Trends, Growth Factors and Opportunities
5.2.2. Market Volume and Forecast, By Region
5.2.3. Market Revenue (US$ Million) and Forecast, By Region
5.3. Business
5.3.1. Key Market Trends, Growth Factors and Opportunities
5.3.2. Market Volume and Forecast, By Region
5.3.3. Market Revenue (US$ Million) and Forecast, By Region
CHAPTER 6: GLOBAL TRANSPORTATION MARKET, BY ORGANIZATION
6.1. Overview
6.1.1. Market Volume and Forecast, 2018-2026
6.1.2. Market Revenue (US$ Million) and Forecast, 2018-2026
6.2. Professional
6.2.1. Key Market Trends, Growth Factors and Opportunities
6.2.2. Market Volume and Forecast, By Region
6.2.3. Market Revenue (US$ Million) and Forecast, By Region
6.3. Business
6.3.1. Key Market Trends, Growth Factors and Opportunities
6.3.2. Market Volume and Forecast, By Region
6.3.3. Market Revenue (US$ Million) and Forecast, By Region
CHAPTER 7: GLOBAL TRANSPORTATION MARKET, BY END-USE
7.1. Overview
7.1.1. Market Volume and Forecast, 2018-2026
7.1.2. Market Revenue (US$ Million) and Forecast, 2018-2026
7.2. Consumer goods
7.2.1. Key Market Trends, Growth Factors and Opportunities
7.2.2. Market Volume and Forecast, By Region
7.2.3. Market Revenue (US$ Million) and Forecast, By Region
7.3. Healthcare
7.3.1. Key Market Trends, Growth Factors and Opportunities
7.3.2. Market Volume and Forecast, By Region
7.3.3. Market Revenue (US$ Million) and Forecast, By Region
7.4. Pharmaceuticals
7.4.1. Key Market Trends, Growth Factors and Opportunities
7.4.2. Market Volume and Forecast, By Region
7.4.3. Market Revenue (US$ Million) and Forecast, By Region
7.5. Food and beverages
7.5.1. Key Market Trends, Growth Factors and Opportunities
7.5.2. Market Volume and Forecast, By Region
7.5.3. Market Revenue (US$ Million) and Forecast, By Region
7.6. Automotive
7.6.1. Key Market Trends, Growth Factors and Opportunities
7.6.2. Market Volume and Forecast, By Region
7.6.3. Market Revenue (US$ Million) and Forecast, By Region
7.7. Aerospace and defense
7.7.1. Key Market Trends, Growth Factors and Opportunities
7.7.2. Market Volume and Forecast, By Region
7.7.3. Market Revenue (US$ Million) and Forecast, By Region
CHAPTER 8: GLOBAL TRANSPORTATION MARKET, BY GEOGRAPHY
8.1. Overview
8.2. North America
8.2.1. Key Market Trends, Growth Factors and Opportunities
8.2.2. Market Volume and Forecast, By Service
8.2.3. Market Volume and Forecast, By Organization
8.2.4. Market Volume and Forecast, By End-Use
8.2.5. Market Revenue and Forecast, By Service
8.2.6. Market Revenue and Forecast, By Organization
8.2.7. Market Revenue and Forecast, By End-Use
8.2.8. Market Revenue and Forecast, By Country
8.2.9. U.S.
8.2.9.1. Market Volume and Forecast
8.2.9.2. Market Revenue and Forecast
8.2.10. Canada
8.2.10.1. Market Volume and Forecast
8.2.10.2. Market Revenue and Forecast
8.2.11. Mexico
8.2.11.1. Market Volume and Forecast
8.2.11.2. Market Revenue and Forecast
8.3. Europe
8.3.1. Market Volume and Forecast, By Service
8.3.2. Market Volume and Forecast, By Organization
8.3.3. Market Volume and Forecast, By End-Use
8.3.4. Market Revenue and Forecast, By Service
8.3.5. Market Revenue and Forecast, By Organization
8.3.6. Market Revenue and Forecast, By End-Use
8.3.7. Market Revenue and Forecast, By Country
8.3.8. Germany
8.3.8.1. Market Volume and Forecast, By Service
8.3.8.2. Market Revenue and Forecast, By Organization
8.3.9. UK
8.3.9.1. Market Volume and Forecast, By Service
8.3.9.2. Market Revenue and Forecast, By Organization
8.3.10. France
8.3.10.1. Market Volume and Forecast, By Service
8.3.10.2. Market Revenue and Forecast, By Organization
8.3.11. Italy
8.3.11.1. Market Volume and Forecast, By Service
8.3.11.2. Market Revenue and Forecast, By Organization
8.3.12. Rest of Europe
8.3.12.1. Market Volume and Forecast, By Service
8.3.12.2. Market Revenue and Forecast, By Organization
8.4. Asia-Pacific
8.4.1. Market Volume and Forecast, By Service
8.4.2. Market Volume and Forecast, By Organization
8.4.3. Market Volume and Forecast, By End-Use
8.4.4. Market Revenue and Forecast, By Service
8.4.5. Market Revenue and Forecast, By Organization
8.4.6. Market Revenue and Forecast, By End-Use
8.4.7. Market Revenue and Forecast, By Country
8.4.8. China
8.4.8.1. Market Volume and Forecast, By Service
8.4.8.2. Market Revenue and Forecast, By Organization
8.4.9. India
8.4.9.1. Market Volume and Forecast, By Service
8.4.9.2. Market Revenue and Forecast, By Organization
8.4.10. Japan
8.4.10.1. Market Volume and Forecast, By Service
8.4.10.2. Market Revenue and Forecast, By Organization
8.4.11. South Korea
8.4.11.1. Market Volume and Forecast, By Service
8.4.11.2. Market Revenue and Forecast, By Organization
8.4.12. Rest of Asia-Pacific
8.4.12.1. Market Volume and Forecast, By Service
8.4.12.2. Market Revenue and Forecast, By Organization
8.5. REST OF THE WORLD
8.5.1. Market Volume and Forecast, By Service
8.5.2. Market Volume and Forecast, By Organization
8.5.3. Market Volume and Forecast, By End-Use
8.5.4. Market Revenue and Forecast, By Service
8.5.5. Market Revenue and Forecast, By Organization
8.5.6. Market Revenue and Forecast, By End-Use
8.5.7. Market Revenue and Forecast, By Country
8.5.8. Latin America
8.5.8.1. Market Volume and Forecast, By Service
8.5.8.2. Market Revenue and Forecast, By Organization
8.5.9. Middle East
8.5.9.1. Market Volume and Forecast, By Service
8.5.9.2. Market Revenue and Forecast, By Organization
8.5.10. Africa
8.5.10.1. Market Volume and Forecast, By Service
8.5.10.2. Market Revenue and Forecast, By Organization
CHAPTER 9: COMPETITIVE LANDSCAPE
9.1. Transportation Market Share Analysis, 2018
CHAPTER 10: COMPANY PROFILES
10.1. Exel
10.1.1. Company Overview
10.1.2. Financial Performance
10.1.3. SWOT Analysis
10.2. DHL Danzas
10.2.1. Company Overview
10.2.2. Financial Performance
10.2.3. SWOT Analysis
10.3. Aramex
10.3.1. Company Overview
10.3.2. Financial Performance
10.3.3. SWOT Analysis
10.4. SemiCorp Logistics
10.4.1. Company Overview
10.4.2. Financial Performance
10.4.3. SWOT Analysis
10.5. TNT
10.5.1. Company Overview
10.5.2. Financial Performance
10.5.3. SWOT Analysis
10.6. BlueDart
10.6.1. Company Overview
10.6.2. Financial Performance
10.6.3. SWOT Analysis
10.7. DTDC Worldwide Express
10.7.1. Company Overview
10.7.2. Financial Performance
10.7.3. SWOT Analysis
10.8. Others
10.8.1. Company Overview
10.8.2. Financial Performance
10.8.3. SWOT Analysis
10.9. Balmer Lawrie
10.9.1. Company Overview
10.9.2. Financial Performance
10.9.3. SWOT Analysis
10.10. Gati Transport
10.10.1. Company Overview
10.10.2. Financial Performance
10.10.3. SWOT Analysis
10.11. Safeexpress
10.11.1. Company Overview
10.11.2. Financial Performance
10.11.3. SWOT Analysis
10.12. TNT (Speedage)
10.12.1. Company Overview
10.12.2. Financial Performance
10.12.3. SWOT Analysis
10.13. Container Corporation of India (CONCOR)
10.13.1. Company Overview
10.13.2. Financial Performance
10.13.3. SWOT Analysis
10.14. Associated Road Carriers Ltd
10.14.1. Company Overview
10.14.2. Financial Performance
10.14.3. SWOT Analysis
PURCHASE OPTIONS
20% Free Customization ON ALL PURCHASE
*Terms & Conditions Apply
Looking for report on this market in a particular region or country? Get In Touch
Request Free Sample
Please fill in the form below to Request for free Sample Report
-
Office Hours Mon - Sat 10:00 - 16:00
-
Call Us +91 6201075429
-
Send Us Mail sales@marketdecipher.com
Market Decipher is a market research and consultancy firm involved in provision of market reports to organisations of varied sizes; small, large and medium.

© 2018 Market Decipher. All Rights Reserved