U.S. Boiler Market
By Fuel (Natural Gas, Oil, Coal, Others), By Capacity (0.3 – 2.5 MMBtu/hr, 2.5 – 10 MMBtu/hr, 10 – 50 MMBtu/hr, 50 – 100 MMBtu/hr, 100 – 250 MMBtu/hr, > 250 MMBtu/hr), By Technology (Condensing, Non-Condensing), By Product (Hot Water, Steam), By Application (Commercial {Offices, Warehouse & Storage, Retail, Education, Lodgings, Public Assembly, Healthcare, Others}, Industrial { Food processing, Pulp & Paper, Chemical, Refining, Primary Metal, Others}), Industry Analysis Report, Regional Outlook (Illinois, Indiana, Michigan, Ohio, Wisconsin, Arkansas, Louisiana, Oklahoma, Texas, Delaware, Florida, Georgia, Maryland, North Carolina, South Carolina, Virginia, West Virginia, Washington D.C., Connecticut, Maine, Massachusetts, New Hampshire, Rhode Island, Vermont, New Jersey, New York, Pennsylvania, Alabama, Kentucky, Mississippi, Tennessee, Iowa, Kansas, Minnesota, Missouri, Nebraska, North Dakota, South Dakota, Alaska, California, Hawaii, Oregon, Washington, Arizona, Colorado, Utah, Nevada, New Mexico, Idaho, Montana, Wyoming)
- Report ID : MD1459 |
- Pages : 240 |
- Tables : 85 |
- Formats :


A boiler is an equipment that produces steam through the combustion of desirable substances, referred to as fuel. The fuel involved can vary depending on the technology of the boiler. This includes Coal, Natural Gas, and wood chips.
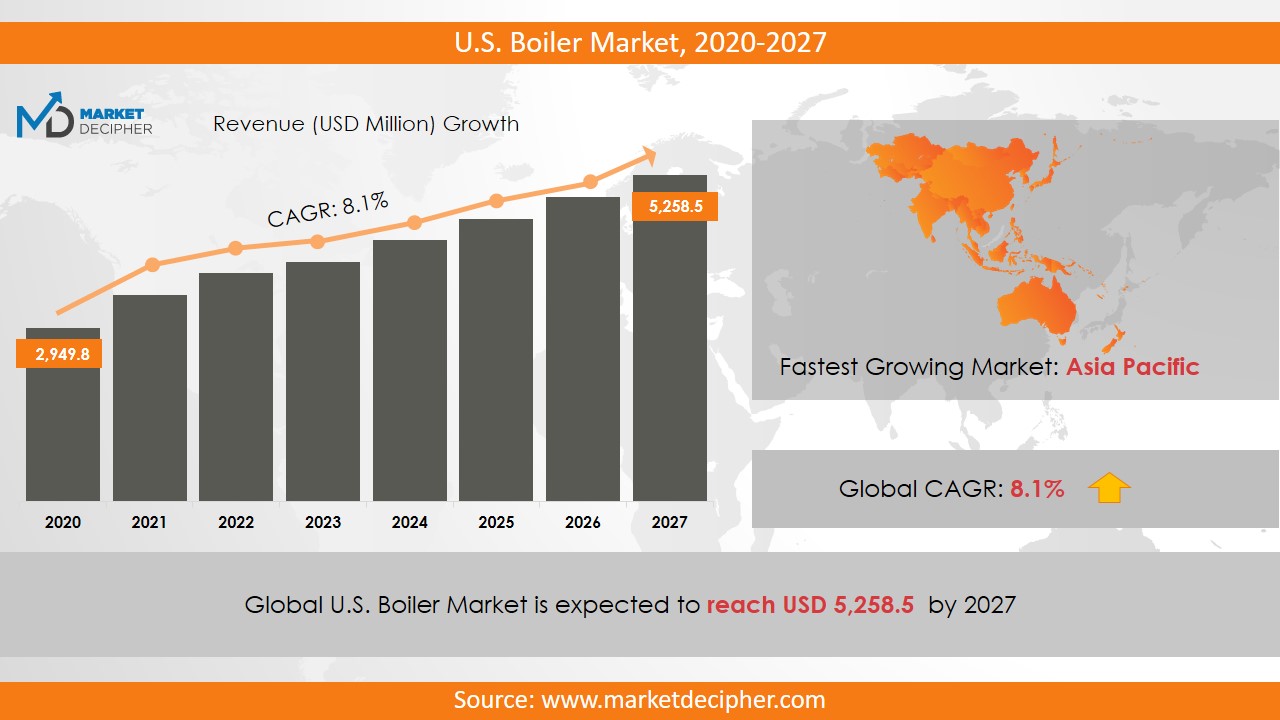
U.S. Boiler Market size was estimated at $1,729.6 Million in 2022 and is expected to reach $2,983.5 Million by 2027, growing at a CAGR of 8.1% during the forecast period of 2022 to 2028.
Analysis by Fuel
The fuel types are Natural Gas, Oil, Coal, and Others.
A mammoth share is held by Natural Gas owing to its easy availability. This fuel is easy to extract and the infrastructure required is well in place. Its humongous reserves will ensure that most of the new boilers are made compatible to work with it. Thus, it will continue to dominate the market share.
Analysis by Capacity
The capacities can be segmented into 0.3 – 2.5 MMBtu/hr, 2.5 – 10 MMBtu/hr, 10 – 50 MMBtu/hr, 50 – 100 MMBtu/hr, 100 – 250 MMBtu/hr, and > 250 MMBtu/hr.
The 0.3 – 2.5 MMBtu/hr capacity models are most in-demand on account of their smaller size and ease of operations. Thus, it is widely adopted by many industries. Many new industries with heating requirements are bound to come up in the forecasted period and this will be their choice of boiler.
Analysis by Technology
There are two primary technology segments: Condensing and Non-Condensing.
Non-condensing systems have a slight operational disadvantage over their condensing boiler counterparts. However, their competitive upfront costs, simple installation, and stable functioning even in harsh weather conditions will propel their growth in this timeframe.
Analysis by Product
According to Product, the two variations are Hot water and Steam.
The hot water systems are garnering a lot of customer attention due to their efficiency. The government policies are also aimed towards energy-efficient systems and this is bound to drive the product adoption for Hot Water systems. Green building and LEED certifications have been included in a lot of industrial codes.
Analysis by Application
According to the application, there are two main segments which have their further chains. These are Commercial and Industrial. The commercial ones include Offices, Warehouse & Storage, Retail, Education, Lodgings, Public Assembly, Healthcare, and Others while the Industrial ones include Food processing, Pulp & Paper, Chemical, Refining, Primary Metal, and Others.
The healthcare segment will witness the highest growth percentage. Emphasis on renewing healthcare infrastructure will be the main reason behind healthy market capitalization. Financial support is also finding its way in the healthcare sector.
Analysis by Region
The East North Central region will lead the consumption of boilers. This is because a lot of industries have been finalized for this geography. These industries vary from machinery, chemical, and Food & Beverage. Michigan, Ohio, and Indiana are among the hotspots for Boiler applications. These locations favor product deployment as well.
Analysis by Market
Important companies in this space include Fulton, Columbia Boiler, Miura, Clayton, Hurst Boiler, P. M. Lattner, Parker Boiler, Cleaver-Brooks, Victory Energy, Calderas Powermaster, Williams & Davis, Sioux, Bryan Steam, York-Shipley, Acme Easco Boiler, and RBI Boilers.
Largescale capital infusions in R&D are taking place. The focus on designing and commercialization of environmentally conscious products. This augurs very well for the industry’s growth.
COVERAGE HIGHLIGHTS
● Market Revenue Estimation and Forecast (2022 – 2031)
● Market Production Estimation and Forecast (2022 – 2031)
● Market Sales/Consumption Volume Estimation and Forecast (2022 – 2031)
● Breakdown of Revenue by Segments (2022 – 2031)
● Breakdown of Production by Segments (2022 – 2031)
● Breakdown of Sales Volume by Segments (2022 – 2031)
● Gross Margin and Profitability Analysis of Companies
● Business Trend and Expansion Analysis
● Import and Export Analysis
● Regional Analysis and Market Data Breakdown
MARKET SEGMENTATION
By FuelOutlook ($Revenue and Unit Sales, 2022-2031)
• Natural Gas
• Oil
• Coal
• Others
By CapacityOutlook ($Revenue and Unit Sales, 2022-2031)
• 0.3 – 2.5 MMBtu/hr
• 2.5 – 10 MMBtu/hr
• 10 – 50 MMBtu/hr
• 50 – 100 MMBtu/hr
• 100 – 250 MMBtu/hr
• > 250 MMBtu/hr
By TechnologyOutlook ($Revenue and Unit Sales, 2022-2031)
• Condensing
• Non-Condensing
By ProductOutlook ($Revenue and Unit Sales, 2022-2031)
• Hot Water
• Steam
By ApplicationOutlook ($Revenue and Unit Sales, 2022-2031)
• Commercial
• Offices
• Warehouse & Storage
• Retail
• Education
• Lodgings
• Public Assembly
• Healthcare
• Others
• Industrial
• Food Processing
• Pulp & Paper
• Chemical
• Refining
• Primary Metal
• Others
By Regional Outlook ($Revenue and Unit Sales, 2022-2031)
• East North Central
o Illinois
o Indiana
o Michigan
o Ohio
o Wisconsin
• West South Central
o Arkansas
o Louisiana
o Oklahoma
o Texas
• South Atlantic
o Delaware
o Florida
o Georgia
o Maryland
o North Carolina
o South Carolina
o Virginia
o West Virginia
o Washington D.C.
• North East
o Connecticut
o Maine
o Massachusetts
o New Hampshire
o Rhode Island
o Vermont
o New Jersey
o New York
o Pennsylvania
• East South Central
o Alabama
o Kentucky
o Mississippi
o Tennessee
• West North Central
o Iowa
o Kansas
o Minnesota
o Missouri
o Nebraska
o North Dakota
o South Dakota
• Pacific States
o Alaska
o California
o Hawaii
o Oregon
o Washington
• Mountain States
o Arizona
o Colorado
o Utah
o Nevada
o New Mexico
o Idaho
o Montana
o Wyoming
Market Players
• Fulton Boiler Works
• Columbia Boiler Company
• Miura America
• Clayton Industries
• Hurst Boiler and Welding Co
• P. M. Lattner Manufacturing Company
• Parker Boiler Company
• Cleaver-Brooks
• Superior Boiler Works
• Vapor Power International
• Victory Energy Operations
• Calderas Powermaster
• Williams & Davis Boilers
• Sioux Corporation
• Bryan Steam
• Unilux Advanced Manufacturing
• York-Shipley
• Acme Engineering Prod.
• Easco Boiler Corp
• RBI Boilers
• Johnston Boiler Company
• Rite Engineering and Manufacturing
• Precision Boilers
• Northwest Manufacturing
• Babcock and Wilcox Enterprises
• Weil-McLain
• A. O. Smith
• Bradford White Corporation
• PB Heat
• Burnham Holdings
Need Report on a particular Country OR need a Tailored/Customized Research? Budget Limits/Price Discounts Query...!
Email to David Correa
OR Fill the below "Sample Request FORM" with your queries in the message box.
CHAPTER 1: INTRODUCTION
1.1. RESEARCH METHODOLOGY
1.1.1. Desk Research
1.1.2. Data Synthesis
1.1.3. Data Validation & Market Feedback
1.1.4. Data Sources
CHAPTER 2: EXECUTIVE SUMMARY
2.1. GLOBAL MARKET OUTLOOK
2.2. CORE INSIGHTS –DELIVERY MODEL
2.3. CORE INSIGHTS – U.S. BOILER
2.4. CORE INSIGHTS – SERVICE PROVIDER
2.5. CORE INSIGHTS – GEOGRAPHY
CHAPTER 3: MARKET OVERVIEW
3.1. MARKET DEFINITION AND SCOPE
3.2. KEY FORCES SHAPING THE INDUSTRY
3.2.1. Bargaining Power of Suppliers
3.2.2. Bargaining Power of Buyers
3.2.3. Threat of Substitutes
3.2.4. Threat of New Entrants
3.3. MARKET DYNAMICS
3.3.1. Drivers
3.3.1.1. Supply-side Drivers
3.3.1.2. Demand-side Drivers
3.3.2. Restraints
3.3.3. Opportunities
3.4. INDUSTRY - ANALYSIS
3.4.1. Political Market
3.4.2. Environmental Market
3.4.3. Social Market
3.4.4. Technology Market
CHAPTER 4: MARKET BACKGROUND
4.1. Industry Value Chain Analysis
4.1.1. Upstream Participants
4.1.2. Downstream participants
4.2. Pricing Analysis and Forecast, 2019-2026
4.2.1. By Type
4.2.2. By Region
CHAPTER 5: U.S. BOILER MARKET, BY FUEL OUTLOOK
5.1. Overview
5.1.1. Market Revenue (US$ Million) and Forecast, 2019-2026
5.2. Natural Gas
5.2.1. Key Market Trends, Growth Factors and Opportunities
5.2.2. Market Revenue (US$ Million) and Forecast, By Region
5.3. Oil
5.3.1. Key Market Trends, Growth Factors and Opportunities
5.3.2. Market Revenue (US$ Million) and Forecast, By Region
5.4. Coal
5.4.1. Key Market Trends, Growth Factors and Opportunities
5.4.2. Market Revenue (US$ Million) and Forecast, By Region
5.5. Others
5.5.1. Key Market Trends, Growth Factors and Opportunities
5.5.2. Market Revenue (US$ Million) and Forecast, By Region
CHAPTER 6: U.S. BOILER MARKET BY CAPACITY OUTLOOK
6.1. Overview
6.1.1. Market Revenue (US$ Million) and Forecast, 2019-2026
6.2. 0.3 – 2.5 MMBtu/hr
6.2.1. Key Market Trends, Growth Factors and Opportunities
6.2.2. Market Revenue (US$ Million) and Forecast, By Region
6.3. 2.5 – 10 MMBtu/hr
6.3.1. Key Market Trends, Growth Factors and Opportunities
6.3.2. Market Revenue (US$ Million) and Forecast, By Region
6.4. 10 – 50 MMBtu/hr
6.4.1. Key Market Trends, Growth Factors and Opportunities
6.4.2. Market Revenue (US$ Million) and Forecast, By Region
6.5. 50 – 100 MMBtu/hr
6.5.1. Key Market Trends, Growth Factors and Opportunities
6.5.2. Market Revenue (US$ Million) and Forecast, By Region
6.6. 100 – 250 MMBtu/hr
6.6.1. Key Market Trends, Growth Factors and Opportunities
6.6.2. Market Revenue (US$ Million) and Forecast, By Region
6.7. > 250 MMBtu/hr
6.7.1. Key Market Trends, Growth Factors and Opportunities
6.7.2. Market Revenue (US$ Million) and Forecast, By Region
CHAPTER 7: U.S. BOILER MARKET BY PRODUCT OUTLOOK
7.1. Overview
7.1.1. Market Revenue (US$ Million) and Forecast, 2019-2026
7.2. Hot Water
7.2.1. Key Market Trends, Growth Factors and Opportunities
7.2.2. Market Revenue (US$ Million) and Forecast, By Region
7.3. Steam
7.3.1. Key Market Trends, Growth Factors and Opportunities
CHAPTER 7: U.S. BOILER MARKET BY APPLICATION OUTLOOK
8.1. Overview
8.1.1. Market Revenue (US$ Million) and Forecast, 2019-2026
8.2. Commercial
8.2.1. Key Market Trends, Growth Factors and Opportunities
8.2.2. Market Revenue (US$ Million) and Forecast, By Region
8.3. Offices
8.3.1. Key Market Trends, Growth Factors and Opportunities
8.4. Warehouse & Storage
8.4.1. Key Market Trends, Growth Factors and Opportunities
8.4.2. Market Revenue (US$ Million) and Forecast, By Region
8.5. Retail
8.5.1. Key Market Trends, Growth Factors and Opportunities
8.5.2. Market Revenue (US$ Million) and Forecast, By Region
8.6. Education
8.6.1. Key Market Trends, Growth Factors and Opportunities
8.6.2. Market Revenue (US$ Million) and Forecast, By Region
8.7. Lodgings
8.7.1. Key Market Trends, Growth Factors and Opportunities
8.7.2. Market Revenue (US$ Million) and Forecast, By Region
8.8. Public Assembly
8.8.1. Key Market Trends, Growth Factors and Opportunities
8.8.2. Market Revenue (US$ Million) and Forecast, By Region
8.9. Healthcare
8.9.1. Key Market Trends, Growth Factors and Opportunities
8.9.2. Market Revenue (US$ Million) and Forecast, By Region
8.10. Others
8.10.1. Key Market Trends, Growth Factors and Opportunities
8.10.2. Market Revenue (US$ Million) and Forecast, By Region
8.11. Industrial
8.11.1. Key Market Trends, Growth Factors and Opportunities
8.11.2. Market Revenue (US$ Million) and Forecast, By Region
8.12. Food Processing
8.12.1. Key Market Trends, Growth Factors and Opportunities
8.12.2. Market Revenue (US$ Million) and Forecast, By Region
8.13. Pulp & Paper
8.13.1. Key Market Trends, Growth Factors and Opportunities
8.13.2. Market Revenue (US$ Million) and Forecast, By Region
8.14. Chemical
8.14.1. Key Market Trends, Growth Factors and Opportunities
8.14.2. Market Revenue (US$ Million) and Forecast, By Region
8.15. Refining
8.15.1. Key Market Trends, Growth Factors and Opportunities
8.15.2. Market Revenue (US$ Million) and Forecast, By Region
8.16. Primary Metal
8.16.1. Key Market Trends, Growth Factors and Opportunities
8.16.2. Market Revenue (US$ Million) and Forecast, By Region
8.17. Others
8.17.1. Key Market Trends, Growth Factors and Opportunities
8.17.2. Market Revenue (US$ Million) and Forecast, By Region
CHAPTER 9: U.S. BOILER MARKET, BY GEOGRAPHY
9.1. Overview
9.2. North America
9.2.1. Key Market Trends, Growth Factors and Opportunities
9.2.2. Market Revenue and Forecast, By Delivery Model
9.2.3. Market Revenue and Forecast, By Agriculture Type
9.2.4. Market Revenue and Forecast, By Service Provider
9.2.5. Market Revenue and Forecast, By Country
9.2.6. U.S.
9.2.6.1. Market Revenue and Forecast
9.2.7. Canada
9.2.7.1. Market Revenue and Forecast
9.2.8. Mexico
9.2.8.1. Market Revenue and Forecast
9.3. Europe
9.3.1. Market Revenue and Forecast, By Delivery Model
9.3.2. Market Revenue and Forecast, By Agriculture Type
9.3.3. Market Revenue and Forecast, By Service Provider
9.3.4. Market Revenue and Forecast, By Country
9.3.5. Germany
9.3.5.1. Market Revenue and Forecast
9.3.6. UK
9.3.6.1. Market Revenue and Forecast
9.3.7. France
9.3.7.1. Market Revenue and Forecast
9.3.8. Italy
9.3.8.1. Market Revenue and Forecast
9.3.9. Spain
9.3.9.1. Market Revenue and Forecast
9.3.10. Poland
9.3.10.1. Market Revenue and Forecast
9.3.11. Austrai
9.3.11.1. Market Revenue and Forecast
9.3.12. Luxembourg
9.3.12.1. Market Revenue and Forecast
9.3.13. Rest of Europe
9.3.13.1. Market Revenue and Forecast
9.4. Asia-Pacific
9.4.1. Market Revenue and Forecast, By Delivery Model
9.4.2. Market Revenue and Forecast, By Agriculture Type
9.4.3. Market Revenue and Forecast, By Service Provider
9.4.4. Market Revenue and Forecast, By Country
9.4.5. China
9.4.5.1. Market Revenue and Forecast
9.4.6. India
9.4.6.1. Market Revenue and Forecast
9.4.7. Japan
9.4.7.1. Market Revenue and Forecast
9.4.8. South Korea
9.4.8.1. Market Revenue and Forecast
9.4.9. Rest of APAC
9.4.9.1. Market Revenue and Forecast
9.5. REST OF THE WORLD
9.5.1. Market Revenue and Forecast, By Delivery Model
9.5.2. Market Revenue and Forecast, By Agriculture Type
9.5.3. Market Revenue and Forecast, By Service Provider
9.5.4. Market Revenue and Forecast, By Country
9.5.5. Latin America
9.5.5.1. Market Revenue and Forecast
9.5.6. Middle East
9.5.6.1. Market Revenue and Forecast
9.5.7. Africa
9.5.7.1. Market Revenue and Forecast
CHAPTER 10: COMPANY PROFILES
10.1. Airbus S.A.S
10.1.1. Company Overview
10.1.2. Financial Performance
10.1.3. SWOT Analysis
10.2. Aviation Industry Corporation of China Ltd. (AVIC)
10.2.1. Company Overview
10.2.2. Financial Performance
10.2.3. SWOT Analysis
10.3. Astronics Corporation
10.3.1. Company Overview
10.3.2. Financial Performance
10.3.3. SWOT Analysis
10.4. Boeing
10.4.1. Company Overview
10.4.2. Financial Performance
10.4.3. SWOT Analysis
10.5. Ball Corporation
10.5.1. Company Overview
10.5.2. Financial Performance
10.5.3. SWOT Analysis
10.6. BAE Systems
10.6.1. Company Overview
10.6.2. Financial Performance
10.6.3. SWOT Analysis
10.7. Cobham plc
10.7.1. Company Overview
10.7.2. Financial Performance
10.7.3. SWOT Analysis
10.8. Curtiss Wright
10.8.1. Company Overview
10.8.2. Financial Performance
10.8.3. SWOT Analysis
10.9. Elbit System
10.9.1. Company Overview
10.9.2. Financial Performance
10.9.3. SWOT Analysis
10.10. Gramin Ltd
10.10.1. Company Overview
10.10.2. Financial Performance
10.10.3. SWOT Analysis
10.11. GE Aviation
10.11.1. Company Overview
10.11.2. Financial Performance
10.11.3. SWOT Analysis
10.12. Harris Corporation
10.12.1. Company Overview
10.12.2. Financial Performance
10.12.3. SWOT Analysis
10.13. Honeywell International Inc.
10.13.1. Company Overview
10.13.2. Financial Performance
10.13.3. SWOT Analysis
10.14. Lockheed Martin Corporation
10.14.1. Company Overview
10.14.2. Financial Performance
10.14.3. SWOT Analysis
10.15. L3 Harris Corporation
10.15.1. Company Overview
10.15.2. Financial Performance
10.15.3. SWOT Analysis
10.16. Meggitt PLC
10.16.1. Company Overview
10.16.2. Financial Performance
10.16.3. SWOT Analysis
10.17. Northrop Grumman Corporation
10.17.1. Company Overview
10.17.2. Financial Performance
10.17.3. SWOT Analysis
10.18. Nucon Aerospace
10.18.1. Company Overview
10.18.2. Financial Performance
10.18.3. SWOT Analysis
10.19. Panasonic Corporation
10.19.1. Company Overview
10.19.2. Financial Performance
10.19.3. SWOT Analysis
10.20. Rolls Royce
10.20.1. Company Overview
10.20.2. Financial Performance
10.20.3. SWOT Analysis
10.21. Raytheon Company
10.21.1. Company Overview
10.21.2. Financial Performance
10.21.3. SWOT Analysis
10.22. Saab AB
10.22.1. Company Overview
10.22.2. Financial Performance
10.22.3. SWOT Analysis
10.23. Safran
10.23.1. Company Overview
10.23.2. Financial Performance
10.23.3. SWOT Analysis
10.24. Thales Group
10.24.1. Company Overview
10.24.2. Financial Performance
10.24.3. SWOT Analysis
10.25. Teledyne Technologies Inc.
10.25.1. Company Overview
10.25.2. Financial Performance
10.25.3. SWOT Analysis
10.26. Transdigm Group Inc.
10.26.1. Company Overview
10.26.2. Financial Performance
10.26.3. SWOT Analysis
PURCHASE OPTIONS
20% Free Customization ON ALL PURCHASE
*Terms & Conditions Apply
Looking for report on this market in a particular region or country? Get In Touch
Request Free Sample
Please fill in the form below to Request for free Sample Report
-
Office Hours Mon - Sat 10:00 - 16:00
-
Call Us +91 6201075429
-
Send Us Mail sales@marketdecipher.com
Market Decipher is a market research and consultancy firm involved in provision of market reports to organisations of varied sizes; small, large and medium.

© 2018 Market Decipher. All Rights Reserved