Algorithmic trading Market
Algorithmic trading Market by Component (Software and Hardware), By Trading Type (Bonds, Forex, Stock markets, Commodities, and Cryptocurrency), By Region (North America, Europe, APAC and Rest of the World)
- Report ID : MD1132 |
- Pages : 187 |
- Tables : 92 |
- Formats :


An algorithm is defined as a set of rules to solve a problem. Algorithm Trading is a type of trading that uses powerful computers to run complex mathematical formulas for trading. Owing to the rising acceptance of this technology worldwide, there will be a notable increase in algorithmic trading market shares. With the rise in the adoption of automation in trading, this technology is growing its usage and correspondingly it helps industries in reducing the transaction cost and maximizing the profits. Due to the rising number of cyber attacks, malware attacks and failures in hardware, the industries can face problems. This technology helps in lowering down such risks and therefore is like to grow appreciably during the forecast period. Further, the affordable cost of the implementation of this technology increases the algorithmic trading market size.
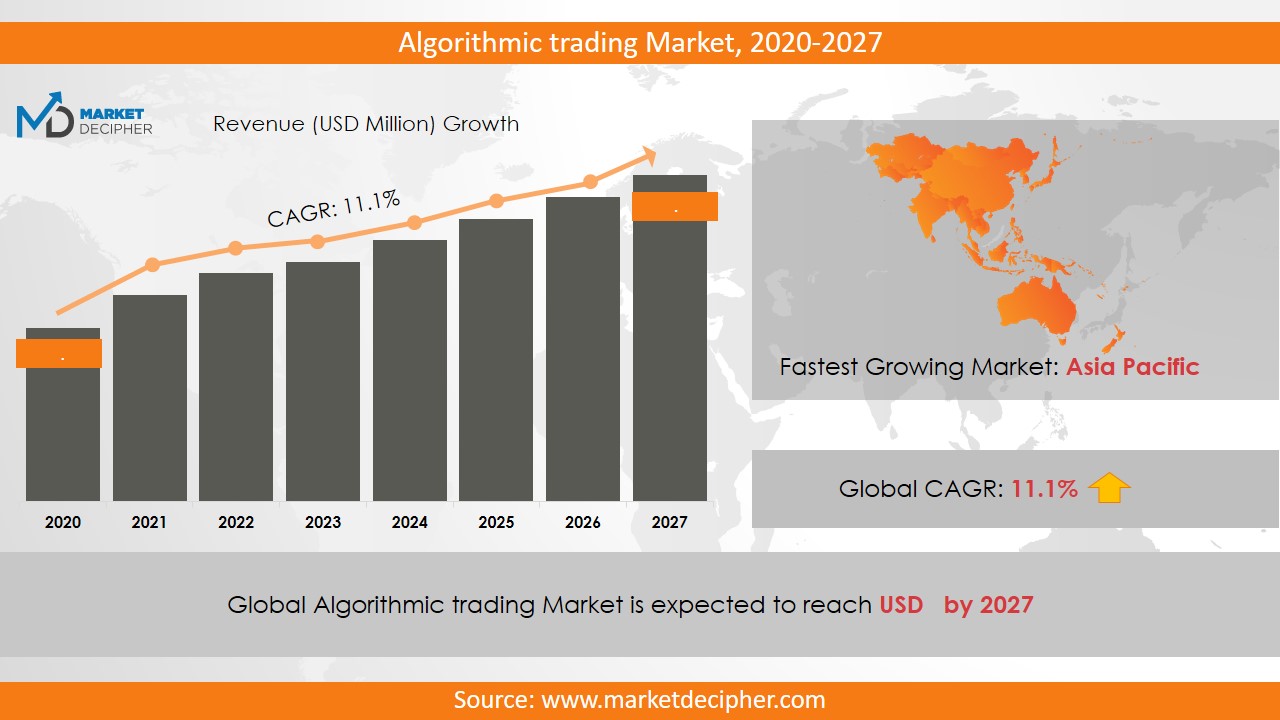
Algorithmic trading market revenue shall reach a value of $20,546.8 Million in 2031, growing with a CAGR of 11.6% during the forecast period of 2022 to 2031.
With the emergence of financial services and artificial intelligence companies, the algorithmic trading market sales have increased notably. Moreover, the rising awareness among consumers about security and safety of sensitive information is leading various industries to adopt a surveillance system significantly and thereby by increasing the algorithmic trading market size. Moreover, the strict rules and regulations by the government to adopt this technology for the sake of efficient trading are anticipated to fuel up the market revenue tremendously over the forecast period.
REGIONAL ANALYSIS
The North America region generated the highest revenue in 2022. The rising adoption of this technology in the region is driving the revenue in North America. Further, the Europe region is anticipated to fuel up the market revenue significantly over the forecast period owing to increment in the stringent rules and regulations of the government in the region. Moreover, the Asia Pacific region is also anticipated to grow significantly over the forecast period owing to the rising investment by developing countries such as India, Japan, and China. The increasing awareness about algorithmic trading in developing countries is anticipated to run the market growth in the Asia Pacific region.
SEGMENT ANALYSIS
Based on the component, the algorithmic trading market report provides a detailed analysis of software and hardware. Further, the software segment has been segmented as cloud, hybrid, and on-premise. Further, the services segment is bifurcated as managed services and professional services where professional services are further segmented as integration and installation, support and maintenance.
Out of which, the cloud segment has dominated the overall market revenue in 2022. By trading type, the segmentation has been done as bonds, forex, stock markets, commodities, and cryptocurrency. Further, the capital market and financial institutions use cloud services excessively to enhance efficiency and productivity and provide customizable and advanced security to their customers.
INDUSTRY PLAYER ANALYSIS
Major industry players have been analyzed with coverage on their operating areas, revenues, and other strategic aspects. These industry players include Trading Technologies International Incorporated, Argo Software Engineering Incorporated, Automated Trading SoftTech Pvt. Ltd., InfoReach Incorporated, Kuberre Systems, MetaQuotes Software Corporation, Software AG, Thomson Reuters Corporation, uTrade, and Vela Trading Systems LLC and Options City Software Incorporated. Other industries in this domain that are growing at a high CAGR include Smart toys Market and 3D Radar Market.
COVERAGE HIGHLIGHTS
• Revenue Estimation and Forecast (2022 – 2031)
• Sales Estimation and Forecast (2022 – 2031)
• Breakdown of Revenue by Segments (2022 – 2031)
• Breakdown of Sales by Segments (2022 – 2031)
• Gross Margin and Profitability Analysis of Companies
• Business Trend and Expansion Analysis
• Regional Analysis and Data Breakdown
SEGMENTAL ANALYSIS
By Component Outlook ($Revenue, 2022-2031)
· Software
· Services
By Trading Type Outlook ($Revenue, 2022-2031)
· Stock Markets
· Bonds
· Forex
· Commodities
· Cryptocurrency
By Regional Outlook ($Revenue and Unit Sales, 2022-2031)
• North America
• Canada
• U.S
• Mexico
• Europe
• Germany
• U.K
• France
• Netherlands
• Austria
• Rest of Europe
• Asia-Pacific
• China
• India
• Japan
• South Korea
• Australia
• Rest of Asia Pacific
• The Middle East and Africa
• Saudi Arabia
• United Arab Emirates
• Rest of Middle East
• Africa
• South America
• Brazil
• Argentina
• Rest of South America
• Rest of the World
• Middle East
• Africa
• Latin America
INDUSTRY PLAYER ANALYSIS:
· Trading Technologies International Incorporated
· Argo Software Engineering Incorporated
· Automated Trading SoftTech Pvt. Ltd.
· InfoReach Incorporated
· Kuberre Systems
· MetaQuotes Software Corporation
· Software AG
· Thomson Reuters Corporation
· uTrade and Vela Trading Systems LLC
· Options City Software Incorporated
Need Report on a particular Country OR need a Tailored/Customized Research? Budget Limits/Price Discounts Query...!
Email to David Correa
OR Fill the below "Sample Request FORM" with your queries in the message box.
CHAPTER 1. INTRODUCTION
1.1. RESEARCH METHODOLOGY
1.1.1. Data Collection
1.1.2. Data Modeling
1.1.3. Historical Revenue and Sales Estimation
1.1.4. Data Triangulation
1.2. RESEARCH PROCESS
1.2.1. Primary Research
1.2.2. Secondary Research
1.2.3. Survey Data
1.2.4. Validation by In-House Expert
1.3. ALGORITHMIC TRADING MARKET OVERVIEW
1.3.1. Research Scope and Market Definition
1.3.2. Executive Summary
CHAPTER 2. GLOBAL ALGORITHMIC TRADING MARKET DEMAND SIDE ANALYSIS
2.1. ALGORITHMIC TRADING MARKET CONSUMPTION VOLUME (MILLION UNITS), 2018 – 2025
2.2. MARKET CONSUMPTION VOLUME SPLIT BY REGION (MILLION UNITS), 2018 – 2025
2.3. MARKET CONSUMPTION VOLUME SPLIT BY COUNTRIES (MILLION UNITS), 2018 – 2025
2.4. MARKET REVENUE (MILLION USD), 2018-2025
2.5. MARKET REVENUE SPLIT BY REGION (MILLION UNITS), 2018 – 2025
2.6. ALGORITHMIC TRADING MARKET REVENUE SPLIT BY COUNTRIES (MILLION UNITS), 2018 – 2025
CHAPTER 3. GLOBAL ALGORITHMIC TRADING MARKET SUPPLY SIDE ANALYSIS
3.1. ALGORITHMIC TRADING MARKET PRODUCTION VOLUME (MILLION UNITS), 2018 – 2025
3.2. MARKET PRODUCTION VOLUME SPLIT BY REGION (MILLION UNITS), 2018-2025
3.3. MARKET PRODUCTION VOLUME SPLIT/RANKING BY COUNTRIES (MILLION UNITS), 2018 – 2025
CHAPTER 4. GLOBAL ALGORITHMIC TRADING MARKET COMPETITIVE SCENARIO & BUSINESS OPPORTUNITY ANALYSIS
4.1. COMPETITIVE STRENGTH RANKING BY MAJOR COUNTRIES, 2018
4.2. MARKET ATTRACTIVENESS RANKING BY MAJOR COUNTRIES, 2018 - 2025
4.3. EMERGING BUSINESS OPPORTUNITIES AND GROWTH PROSPECTS
4.3.1. Growth Drivers
4.3.2. Market Restraints
4.3.2. Opportunities
CHAPTER 5. GLOBAL ALGORITHMIC TRADING MARKET ENTRY STRATEGIES
5.1. ENTRY STRATEGIES IN DEVELOPING MARKETS
5.2. ENTRY STRATEGIES IN DEVELOPED MARKETS
CHAPTER 6. GLOBAL ALGORITHMIC TRADING MARKET BY COMPONENT
6.1. SEGMENT OUTLINE
6.2. REVENUE SHARE BY COMPONENT, $MILLION, 2018 – 2025
6.2. CONSUMPTION SHARE BY COMPONENT, MILLION UNITS, 2018 - 2025
6.3. PRODUCTION SHARE BY COMPONENT, MILLION UNITS, 2018 – 2025
6.4. SOFTWARE
6.4.1. Market determinants and trend analysis
6.4.2. Market revenue, sales and production volume, 2018 – 2025
6.5. SERVICES
6.5.1. Market determinants and trend analysis
6.5.2. Market revenue, sales and production volume, 2018 – 2025
CHAPTER 7. GLOBAL ALGORITHMIC TRADING MARKET BY TRADING TYPE
7.1. SEGMENT OUTLINE
7.2. REVENUE SHARE BY TRADING TYPE, $MILLION, 2018 – 2025
7.2. CONSUMPTION SHARE BY TRADING TYPE, MILLION UNITS, 2018 - 2025
7.3. PRODUCTION SHARE BY TRADING TYPE, MILLION UNITS, 2018 – 2025
7.4. STOCK MARKETS
7.4.1. Market determinants and trend analysis
7.4.2. Market revenue, sales and production volume, 2018 – 2025
7.5. BONDS
7.5.1. Market determinants and trend analysis
7.5.2. Market revenue, sales and production volume, 2018 – 2025
7.6. FOREX
7.6.1. Market determinants and trend analysis
7.6.2. Market revenue, sales and production volume, 2018 – 2025
7.7. COMMODITIES
7.7.1. Market determinants and trend analysis
7.7.2. Market revenue, sales and production volume, 2018 – 2025
7.8. CRYPTOCURRENCY
7.8.1. Market determinants and trend analysis
7.8.2. Market revenue, sales and production volume, 2018 – 2025
CHAPTER 8. GLOBAL ALGORITHMIC TRADING MARKET BY REGIONS
8.1. REGIONAL OUTLOOK
8.2. MARKET PRODUCTION, CONSUMPTION & REVENUE BY REGION, 2018-2025
8.3. NORTH AMERICA
8.3.1. Current Trends and Future Prospects
8.3.2. North America market revenue, sales and production volume, 2018 – 2025
8.3.3. U.S.
8.3.3.1. Algorithmic Trading Market Revenue $Million (2018 – 2025)
8.3.3.2. Algorithmic Trading Market Consumption Million Units (2018 – 2025)
8.3.3.3. Algorithmic Trading Market Production Million Units (2018 – 2025)
8.3.4. Canada
8.3.4.1. Algorithmic Trading Market Revenue $Million (2018 – 2025)
8.3.4.2. Algorithmic Trading Market Consumption Million Units (2018 – 2025)
8.3.4.3. Algorithmic Trading Market Production Million Units (2018 – 2025)
8.3.5. Mexico
8.3.5.1. Algorithmic Trading Market Revenue $Million (2018 – 2025)
8.3.5.2. Algorithmic Trading Market Consumption Million Units (2018 – 2025)
8.3.5.3. Algorithmic Trading Market Production Million Units (2018 – 2025)
8.4. EUROPE
8.4.1. Current Trends and Future Prospects
8.4.2. Europe market revenue, sales and production volume, 2018 – 2025
8.4.3. U.K
8.4.3.1. Algorithmic Trading Market Revenue $Million (2018 – 2025)
8.4.3.2. Algorithmic Trading Market Consumption Million Units (2018 – 2025)
8.4.3.3. Algorithmic Trading Market Production Million Units (2018 – 2025)
8.4.4. Germany
8.4.4.1. Algorithmic Trading Market Revenue $Million (2018 – 2025)
8.4.4.2. Algorithmic Trading Market Consumption Million Units (2018 – 2025)
8.4.4.3. Algorithmic Trading Market Production Million Units (2018 – 2025)
8.4.5. France
8.4.5.1. Algorithmic Trading Market Revenue $Million (2018 – 2025)
8.4.5.2. Algorithmic Trading Market Consumption Million Units (2018 – 2025)
8.4.5.3. Algorithmic Trading Market Production Million Units (2018 – 2025)
8.4.6. Italy
8.4.6.1. Algorithmic Trading Market Revenue $Million (2018 – 2025)
8.4.6.2. Algorithmic Trading Market Consumption Million Units (2018 – 2025)
8.4.6.3. Algorithmic Trading Market Production Million Units (2018 – 2025)
8.4.7. Rest of Europe
8.4.7.1. Algorithmic Trading Market Revenue $Million (2018 – 2025)
8.4.7.2. Algorithmic Trading Market Consumption Million Units (2018 – 2025)
8.4.7.3. Algorithmic Trading Market Production Million Units (2018 – 2025)
8.5. ASIA PACIFIC
8.5.1. Current Trends and Future Prospects
8.5.2. Europe market revenue, sales and production volume, 2018 – 2025
8.5.3. India
8.5.3.1. Algorithmic Trading Market Revenue $Million (2018 – 2025)
8.5.3.2. Algorithmic Trading Market Consumption Million Units (2018 – 2025)
8.5.3.3. Algorithmic Trading Market Production Million Units (2018 – 2025)
8.5.4. Japan
8.5.4.1. Algorithmic Trading Market Revenue $Million (2018 – 2025)
8.5.4.2. Algorithmic Trading Market Consumption Million Units (2018 – 2025)
8.5.4.3. Algorithmic Trading Market Production Million Units (2018 – 2025)
8.5.5. China
8.5.5.1. Algorithmic Trading Market Revenue $Million (2018 – 2025)
8.5.5.2. Algorithmic Trading Market Consumption Million Units (2018 – 2025)
8.5.5.3. Algorithmic Trading Market Production Million Units (2018 – 2025)
8.5.6. South Korea
8.5.6.1. Algorithmic Trading Market Revenue $Million (2018 – 2025)
8.5.6.2. Algorithmic Trading Market Consumption Million Units (2018 – 2025)
8.5.6.3. Algorithmic Trading Market Production Million Units (2018 – 2025)
8.5.7. Rest of APAC
8.5.7.1. Algorithmic Trading Market Revenue $Million (2018 – 2025)
8.5.7.2. Algorithmic Trading Market Consumption Million Units (2018 – 2025)
8.5.7.3. Algorithmic Trading Market Production Million Units (2018 – 2025)
8.6. REST OF THE WORLD
8.6.1. Current Trends and Future Prospects
8.6.2. Europe market revenue, sales and production volume, 2018 – 2025
8.6.3. Latin America
8.6.3.1. Algorithmic Trading Market Revenue $Million (2018 – 2025)
8.6.3.2. Algorithmic Trading Market Consumption Million Units (2018 – 2025)
8.6.3.3. Algorithmic Trading Market Production Million Units (2018 – 2025)
8.6.4. Middle East
8.6.4.1. Algorithmic Trading Market Revenue $Million (2018 – 2025)
8.6.4.2. Algorithmic Trading Market Consumption Million Units (2018 – 2025)
8.6.4.3. Algorithmic Trading Market Production Million Units (2018 – 2025)
8.6.5. Africa
8.6.5.1. Algorithmic Trading Market Revenue $Million (2018 – 2025)
8.6.5.2. Algorithmic Trading Market Consumption Million Units (2018 – 2025)
8.6.5.3. Algorithmic Trading Market Production Million Units (2018 – 2025)
CHAPTER 9. KEY VENDOR PROFILES
9.1. Trading Technologies International Incorporated
9.1.1. Company overview
9.1.2. Portfolio Analysis
9.1.3. Estimated revenue from algorithmic trading business and market share
9.1.4. Regional & business segment Revenue Analysis
9.2. Argo Software Engineering Incorporated
9.2.1. Company overview
9.2.2. Portfolio Analysis
9.2.3. Estimated revenue from algorithmic trading business and market share
9.2.4. Regional & business segment Revenue Analysis
9.3. Automated Trading SoftTech Pvt. Ltd.
9.3.1. Company overview
9.3.2. Portfolio Analysis
9.3.3. Estimated revenue from algorithmic trading business and market share
9.3.4. Regional & business segment Revenue Analysis
9.4. InfoReach Incorporated
9.4.1. Company overview
9.4.2. Portfolio Analysis
9.4.3. Estimated revenue from algorithmic trading business and market share
9.4.4. Regional & business segment Revenue Analysis
9.5. Kuberre Systems
9.5.1. Company overview
9.5.2. Portfolio Analysis
9.5.3. Estimated revenue from algorithmic trading business and market share
9.5.4. Regional & business segment Revenue Analysis
9.6. MetaQuotes Software Corporation
9.6.1. Company overview
9.6.2. Portfolio Analysis
9.6.3. Estimated revenue from algorithmic trading business and market share
9.6.4. Regional & business segment Revenue Analysis
9.7. Software AG
9.7.1. Company overview
9.7.2. Portfolio Analysis
9.7.3. Estimated revenue from algorithmic trading business and market share
9.7.4. Regional & business segment Revenue Analysis
9.8. Thomson Reuters Corporation
9.8.1. Company overview
9.8.2. Portfolio Analysis
9.8.3. Estimated revenue from algorithmic trading business and market share
9.8.4. Regional & business segment Revenue Analysis
9.9. uTrade and Vela Trading Systems LLC
9.9.1. Company overview
9.9.2. Portfolio Analysis
9.9.3. Estimated revenue from algorithmic trading business and market share
9.9.4. Regional & business segment Revenue Analysis
9.10. Options City Software Incorporated
9.10.1. Company overview
9.10.2. Portfolio Analysis
9.10.3. Estimated revenue from algorithmic trading business and market share
9.10.4. Regional & business segment Revenue Analysis
PURCHASE OPTIONS
20% Free Customization ON ALL PURCHASE
*Terms & Conditions Apply
Looking for report on this market in a particular region or country? Get In Touch
Request Free Sample
Please fill in the form below to Request for free Sample Report
-
Office Hours Mon - Sat 10:00 - 16:00
-
Call Us +91 6201075429
-
Send Us Mail sales@marketdecipher.com
Market Decipher is a market research and consultancy firm involved in provision of market reports to organisations of varied sizes; small, large and medium.

© 2018 Market Decipher. All Rights Reserved