Auto Driving Vehicles Market
By Type (Semi- automated and fully automated), By Level of Automation (Level 3, Level 4 and Level 5), By Component (Hardware, Software and Service), By Application (Defense and Transportation), By Region (North America, Europe, APAC and Rest of the World)
- Report ID : MD1192 |
- Pages : 181 |
- Tables : 83 |
- Formats :


Auto Driving Vehicles Market revenue shall reach value of $XX.X Billion in 2026, growing with a CAGR of X.X% during the forecast period of 2018 to 2026. In terms of volume sales, the market is anticipated to reach XX Units.
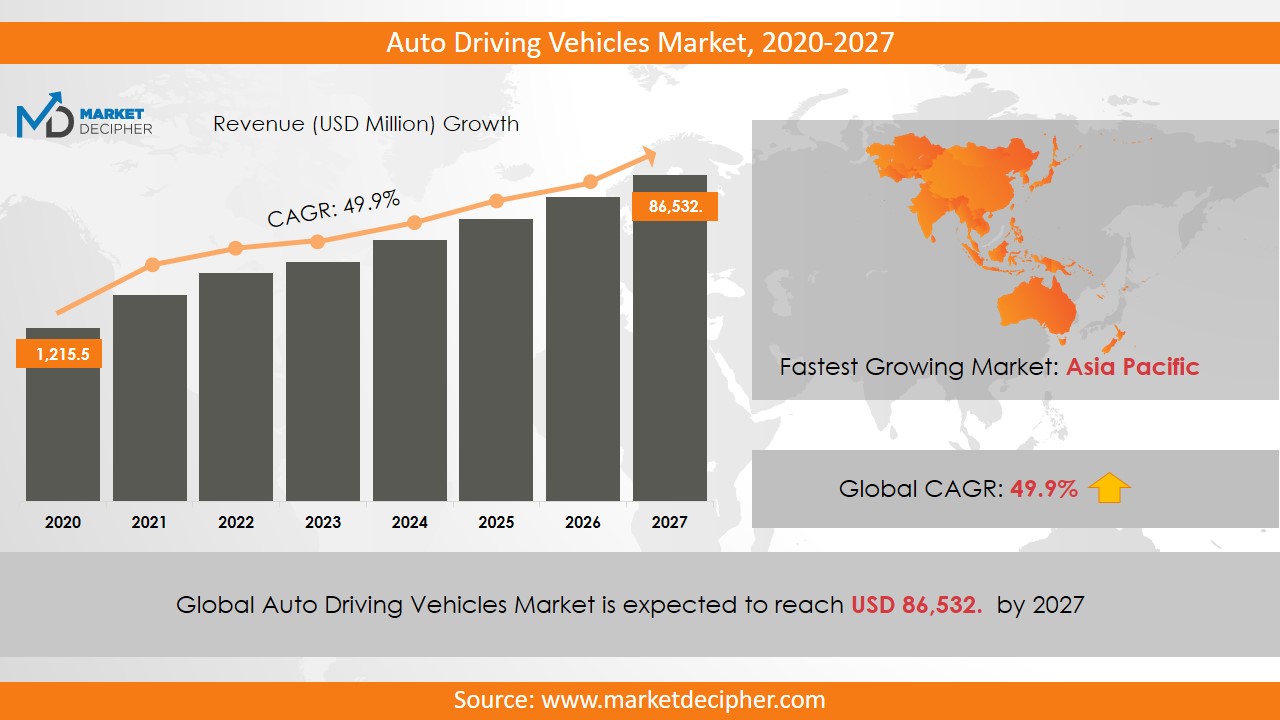
Auto driving vehicles have been developed at a significant pace since last few years to meet the security needs of the drivers and passengers. These vehicles are equipped with a number of sensors such as LIDAR and RADAR which function simultaneously to work in the absence of drivers. Rapid development in automotive industry and increased safety concerns contribute considerably to the auto driving vehicles market growth. Increased budget of government sector and notable contribution from regulatory authorities are the major revenue drivers. Moreover, the government sector is investing heavily in this sector to expand the auto driving vehicles market size by the end of forecast period.
According to recent auto driving vehicles market report, the high demand for upgrading vehicles will drive the auto driving vehicles market shares greatly in future. Apart from this, less number of premium consumers as compared to the economic consumers and high initial investment required in manufacturing these vehicles is interrupting the market growth. In the year 2017, Audi launched its A8 that can be fully automated at speeds up to 60km/hour. It would be lashed with safety checks along with the advanced technologies.
REGIONAL ANALYSIS
Being a highly developed region, North America has expanded the auto driving vehicles business size. In 2018, various rules have been implemented by North American government to upgrade transportation facilities. Countries such as Florida, California, Washington DC, Nevada and Michigan allow these vehicles in many of their states. Moreover, transportation department have removed the taxws on driving these vehicles on any road which is expected to drive the market shares greatly. Government of developing countries such as India, China and Japan is planning to maximize the Asian auto driving vehicles business revenue. Further, Europe is expected to grow at a CAGR of 42.5% during the forecast period.
SEGMENT ANALYSIS
Transportation sector dominated the market in terms of revenue. This segment is further classified as commercial and industrial. These vehicles find their extensive application in commercial sector. Moreover, on the basis of level of automation, the segmentation has been done as level 3, level 4 and level 5. Most of the automated vehicles have level 3 or level 4 automation. Due to the high cost and lack of awareness about such technology is responsible for low growth of level 5 sensors.
Level 3 of automation will serve majority of the auto driving vehicles in coming years. It provides conditional automation to vehicles and makes the vehicle capable of managing critical situations of accidents. However, in some critical solutions the attention of driver is required in shch vehicles. Moreover, semi automated vehicles are likely to have greater impact across the world as compared to the fully automated vehicles. Moreover, fully automated vehicles are more prone to cyber attacks.
INDUSTRY PLAYER ANALYSIS
Daimler AG, BMW, Audi AG, Ford Motor Company, Honda Motor Corporation, General Motors, Google LLC, Tesla Incorporated, Nissan Motor Company, Toyota Motor Corporation, Volvo Car Corporation, Uber Technologies Incorporated and Volkswagen AG are the leading market vendors which are adopting new strategies to acquire acquisition all over the globe. A number of industry players including BMW, Audi and Intel Corporation have joined the auto driving vehicles industries to expand their business size. Other industries in this domain that are growing at a high CAGR include Digital Business Support System Market and DIY Furniture Market.
COVERAGE HIGHLIGHTS
• Revenue Estimation and Forecast (2018 – 2026)
• Production Estimation and Forecast (2018 – 2026)
• Sales/Consumption Volume Estimation and Forecast (2018 – 2026)
• Breakdown of Revenue by Segments (2018 – 2026)
• Breakdown of Production by Segments (2018 – 2026)
• Breakdown of Sales Volume by Segments (2018 – 2026)
• Gross Margin and Profitability Analysis of Companies
• Business Trend and Expansion Analysis
• Import and Export Analysis
• Regional Analysis and Data Breakdown
SEGMENTAL ANALYSIS
By Type Outlook ($Revenue and Unit Sales, 2018-2026)
• Semi-automated
• Fully-automated
By Level of Automation ($Revenue and Unit Sales, 2018-2026)
• Level 3
• Level 4
• Level 5
By Components ($Revenue and Unit Sales, 2018-2026)
• Hardware
• Software
• Service
By Application Outlook ($Revenue and Unit Sales, 2018-2026)
• Defense
• Transportation
By Regional Outlook ($Revenue and Unit Sales, 2018-2026)
• North America
• Canada
• U.S
• Mexico
• Europe
• Germany
• U.K
• France
• Netherlands
• Austria
• Rest of Europe
• Asia-Pacific
• China
• India
• Japan
• South Korea
• Australia
• Rest of Asia Pacific
• The Middle East and Africa
• Saudi Arabia
• United Arab Emirates
• Rest of Middle East
• Africa
• South America
• Brazil
• Argentina
• Rest of South America
AUTO DRIVING VEHICLES COMPANIES:
• Daimler AG
• BMW
• Audi AG
• Ford Motor Company
• Honda Motor Corporation
• General Motors
• Google LLC
• Tesla Incorporated
• Nissan Motor Ccompan
• Toyota Motor Corporation
• Volvo Car Corporation
• Uber Technologies Incorporated
• Volkswagen AG
CHAPTER 1: INTRODUCTION
1.1. Research Methodology
1.1.1. Desk Research
1.1.2. Data Synthesis
1.1.3. Data Validation & Market Feedback
1.1.4. Data Sources
CHAPTER 2: EXECUTIVE SUMMARY
2.1. Global Market Outlook
2.2. Core Insights - Type
2.3. Core Insights – Level of Automation
2.4. Core Insights – Component
2.5. Core Insights – Application
2.6. Core Insights – Geography
CHAPTER 3: MARKET OVERVIEW
3.1. Market Definition and Scope
3.2. Key Forces Shaping the Industry
3.2.1. Bargaining Power of Suppliers
3.2.2. Bargaining Power of Buyers
3.2.3. Threat of Substitutes
3.2.4. Threat of New Entrants
3.3. Market Dynamics
3.3.1. Drivers
3.3.1.1. Supply-side Drivers
3.3.1.2. Demand-side Drivers
3.3.2. Restraints
3.3.3. Opportunities
3.4. Industry Landscape - PESTEL Analysis
3.4.1. Political Landscape
3.4.2. Environmental Landscape
3.4.3. Social Landscape
3.4.4. Technology Landscape
3.4.5. Economic Landscape
CHAPTER 4: MARKET BACKGROUND
4.1. Industry Value Chain Analysis
4.1.1. Upstream Participants
4.1.2. Downstream participants
4.2. Pricing Analysis and Forecast, 2018-2026
4.2.1. By Type
4.2.2. By Region
CHAPTER 5: GLOBAL AUTO DRIVING VEHICLES MARKET, BY TYPE
5.1. Overview
5.1.1. Market Volume and Forecast, 2018-2026
5.1.2. Market Revenue (US$ Million) and Forecast, 2018-2026
5.2. Semi-automated
5.2.1. Key Market Trends, Growth Factors and Opportunities
5.2.2. Market Volume and Forecast, By Region
5.2.3. Market Revenue (US$ Million) and Forecast, By Region
5.3. Fully-automated
5.3.1. Key Market Trends, Growth Factors and Opportunities
5.3.2. Market Volume and Forecast, By Region
5.3.3. Market Revenue (US$ Million) and Forecast, By Region
CHAPTER 6: GLOBAL AUTO DRIVING VEHICLES MARKET, BY LEVEL OF AUTOMATION
6.1. Overview
6.1.1. Market Volume and Forecast, 2018-2026
6.1.2. Market Revenue (US$ Million) and Forecast, 2018-2026
6.2. Level 3
6.2.1. Key Market Trends, Growth Factors and Opportunities
6.2.2. Market Volume and Forecast, By Region
6.2.3. Market Revenue (US$ Million) and Forecast, By Region
6.3. Level 4
6.3.1. Key Market Trends, Growth Factors and Opportunities
6.3.2. Market Volume and Forecast, By Region
6.3.3. Market Revenue (US$ Million) and Forecast, By Region
6.4. Level 5
6.4.1. Key Market Trends, Growth Factors and Opportunities
6.4.2. Market Volume and Forecast, By Region
6.4.3. Market Revenue (US$ Million) and Forecast, By Region
CHAPTER 7: GLOBAL AUTO DRIVING VEHICLES MARKET, BY COMPONENTS
7.1. Overview
7.1.1. Market Volume and Forecast, 2018-2026
7.1.2. Market Revenue (US$ Million) and Forecast, 2018-2026
7.2. Hardware
7.2.1. Key Market Trends, Growth Factors and Opportunities
7.2.2. Market Volume and Forecast, By Region
7.2.3. Market Revenue (US$ Million) and Forecast, By Region
7.3. Software
7.3.1. Key Market Trends, Growth Factors and Opportunities
7.3.2. Market Volume and Forecast, By Region
7.3.3. Market Revenue (US$ Million) and Forecast, By Region
7.4. Service
7.4.1. Key Market Trends, Growth Factors and Opportunities
7.4.2. Market Volume and Forecast, By Region
7.4.3. Market Revenue (US$ Million) and Forecast, By Region
CHAPTER 8: GLOBAL AUTO DRIVING VEHICLES MARKET, BY APPLICATION
8.1. Overview
8.1.1. Market Volume and Forecast, 2018-2026
8.1.2. Market Revenue (US$ Million) and Forecast, 2018-2026
8.2. Defense
8.2.1. Key Market Trends, Growth Factors and Opportunities
8.2.2. Market Volume and Forecast, By Region
8.2.3. Market Revenue (US$ Million) and Forecast, By Region
8.3. Transportation
8.3.1. Key Market Trends, Growth Factors and Opportunities
8.3.2. Market Volume and Forecast, By Region
CHAPTER 9: GLOBAL AUTO DRIVING VEHICLES MARKET, BY GEOGRAPHY
9.1. Overview
9.2. North America
9.2.1. Key Market Trends, Growth Factors and Opportunities
9.2.2. Market Volume and Forecast, By Type
9.2.3. Market Volume and Forecast, By Level of Automation
9.2.4. Market Volume and Forecast, By Component
9.2.5. Market Volume and Forecast, By Application
9.2.6. Market Revenue and Forecast, By Type
9.2.7. Market Revenue and Forecast, By Level of Automation
9.2.8. Market Revenue and Forecast, By Component
9.2.9. Market Revenue and Forecast, By Application
9.2.10. Market Revenue and Forecast, By Country
9.2.11. U.S.
9.2.11.1. Market Volume and Forecast
9.2.11.2. Market Revenue and Forecast
9.2.12. Canada
9.2.12.1. Market Volume and Forecast
9.2.12.2. Market Revenue and Forecast
9.2.13. Mexico
9.2.13.1. Market Volume and Forecast
9.2.13.2. Market Revenue and Forecast
9.3. Europe
9.3.1. Market Volume and Forecast, By Type
9.3.2. Market Volume and Forecast, By Level of Automation
9.3.3. Market Volume and Forecast, By Component
9.3.4. Market Volume and Forecast, By Application
9.3.5. Market Revenue and Forecast, By Type
9.3.6. Market Revenue and Forecast, By Level of Automation
9.3.7. Market Revenue and Forecast, By Component
9.3.8. Market Revenue and Forecast, By Application
9.3.9. Market Revenue and Forecast, By Country
9.3.10. Germany
9.3.10.1. Market Volume and Forecast, By Type
9.3.10.2. Market Revenue and Forecast, By Level of Automation
9.3.11. UK
9.3.11.1. Market Volume and Forecast, By Type
9.3.11.2. Market Revenue and Forecast, By Level of Automation
9.3.12. France
9.3.12.1. Market Volume and Forecast, By Type
9.3.12.2. Market Revenue and Forecast, By Level of Automation
9.3.13. Italy
9.3.13.1. Market Volume and Forecast, By Type
9.3.13.2. Market Revenue and Forecast, By Level of Automation
9.3.14. Rest of Europe
9.3.14.1. Market Volume and Forecast, By Type
9.3.14.2. Market Revenue and Forecast, By Level of Automation
9.4. Asia-Pacific
9.4.1. Market Volume and Forecast, By Type
9.4.2. Market Volume and Forecast, By Level of Automation
9.4.3. Market Volume and Forecast, By Component
9.4.4. Market Volume and Forecast, By Application
9.4.5. Market Revenue and Forecast, By Type
9.4.6. Market Revenue and Forecast, By Level of Automation
9.4.7. Market Revenue and Forecast, By Component
9.4.8. Market Revenue and Forecast, By Application
9.4.9. Market Revenue and Forecast, By Country
9.4.10. China
9.4.10.1. Market Volume and Forecast, By Type
9.4.10.2. Market Revenue and Forecast, By Level of Automation
9.4.11. India
9.4.11.1. Market Volume and Forecast, By Type
9.4.11.2. Market Revenue and Forecast, By Level of Automation
9.4.12. Japan
9.4.12.1. Market Volume and Forecast, By Type
9.4.12.2. Market Revenue and Forecast, By Level of Automation
9.4.13. South Korea
9.4.13.1. Market Volume and Forecast, By Type
9.4.13.2. Market Revenue and Forecast, By Level of Automation
9.4.14. Rest of Asia-Pacific
9.4.14.1. Market Volume and Forecast, By Type
9.4.14.2. Market Revenue and Forecast, By Level of Automation
9.5. REST OF THE WORLD
9.5.1. Market Volume and Forecast, By Type
9.5.2. Market Volume and Forecast, By Level of Automation
9.5.3. Market Volume and Forecast, By Component
9.5.4. Market Volume and Forecast, By Application
9.5.5. Market Revenue and Forecast, By Type
9.5.6. Market Revenue and Forecast, By Level of Automation
9.5.7. Market Revenue and Forecast, By Component
9.5.8. Market Revenue and Forecast, By Application
9.5.9. Market Revenue and Forecast, By Country
9.5.10. Latin America
9.5.10.1. Market Volume and Forecast, By Type
9.5.10.2. Market Revenue and Forecast, By Level of Automation
9.5.11. Middle East
9.5.11.1. Market Volume and Forecast, By Type
9.5.11.2. Market Revenue and Forecast, By Level of Automation
9.5.12. Africa
9.5.12.1. Market Volume and Forecast, By Type
9.5.12.2. Market Revenue and Forecast, By Level of Automation
CHAPTER 10: COMPETITIVE LANDSCAPE
10.1. Auto Driving Vehicles Market Share Analysis, 2018
CHAPTER 11: COMPANY PROFILES
11.1. Daimler AG
11.1.1. Company Overview
11.1.2. Financial Performance
11.1.3. SWOT Analysis
11.2. BMW
11.2.1. Company Overview
11.2.2. Financial Performance
11.2.3. SWOT Analysis
11.3. Audi AG
11.3.1. Company Overview
11.3.2. Financial Performance
11.3.3. SWOT Analysis
11.4. Ford Motor Company
11.4.1. Company Overview
11.4.2. Financial Performance
11.4.3. SWOT Analysis
11.5. Honda Motor Corporation
11.5.1. Company Overview
11.5.2. Financial Performance
11.5.3. SWOT Analysis
11.6. General Motors
11.6.1. Company Overview
11.6.2. Financial Performance
11.6.3. SWOT Analysis
11.7. Google LLC
11.7.1. Company Overview
11.7.2. Financial Performance
11.7.3. SWOT Analysis
11.8. Tesla Incorporated
11.8.1. Company Overview
11.8.2. Financial Performance
11.8.3. SWOT Analysis
11.9. Nissan Motor Company
11.9.1. Company Overview
11.9.2. Financial Performance
11.9.3. SWOT Analysis
11.10. Toyota Motor Corporation
11.10.1. Company Overview
11.10.2. Financial Performance
11.10.3. SWOT Analysis
11.11. Volvo Car Corporation
11.11.1. Company Overview
11.11.2. Financial Performance
11.11.3. SWOT Analysis
11.12. Uber Technologies Incorporated
11.12.1. Company Overview
11.12.2. Financial Performance
11.12.3. SWOT Analysis
11.13. Volkswagen AG
11.13.1. Company Overview
11.13.2. Financial Performance
11.13.3. SWOT Analysis
PURCHASE OPTIONS
20% Free Customization ON ALL PURCHASE
*Terms & Conditions Apply
Looking for report on this market in a particular region or country? Get In Touch
Request Free Sample
Please fill in the form below to Request for free Sample Report
-
Office Hours Mon - Sat 10:00 - 16:00
-
Call Us +91 6201075429
-
Send Us Mail sales@marketdecipher.com
Market Decipher is a market research and consultancy firm involved in provision of market reports to organisations of varied sizes; small, large and medium.

© 2018 Market Decipher. All Rights Reserved