Multi Touch Screen Market Revenue, Sales Volume& Trend Forecasts Report, 2019-2026
By Technology (Optical, Infrared, Resistive, Acoustic, and Capacitive), By Application (Government, Enterprise, Retail, Industrial, Medical, Military, and Commercial), By Devices (Gaming Systems, Smartphone, POS systems, Tablets, Large displays, and Television), By Region (North America, Europe, APAC and Rest of the World)
- Report ID : MD1012 |
- Pages : 196 |
- Tables : 92 |
- Formats :


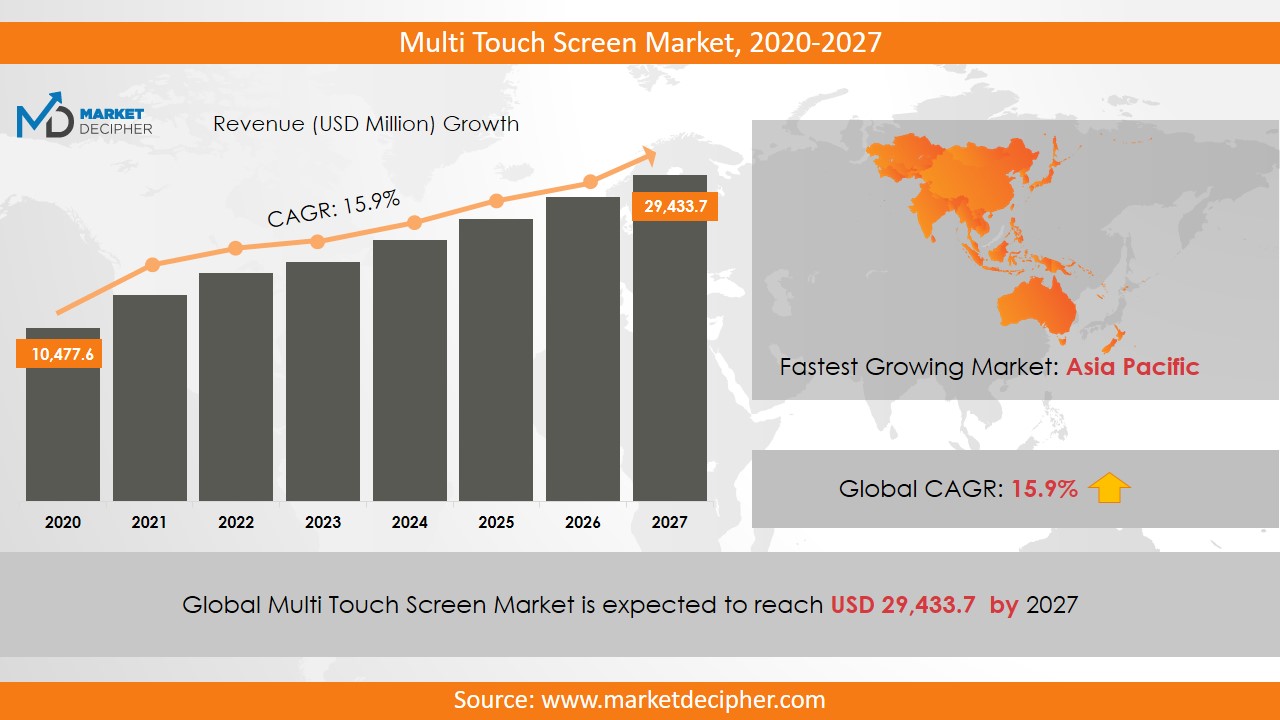
Multi-Touch Screen market revenue shall reach a value of $20.8 Billion in 2026, growing with a CAGR of 15.7% during the forecast period of 2018 to 2026. In terms of volume sales, the market is anticipated to reach XX Units.
The multi-touch screen is a rapidly growing and emerging technology, capable to detect input from one or more points of contact. It provides better replacement than the standard keyboard and enables consumers to regulate graphical applications using different fingers. It works on the principle of capacitive touch technology and provides interactive features for integrated devices. The use of gadgets like smartphones and tablets is increasing, which will lead to a rise in the multi-touch screen market sales. The demand for advanced features is also increasing in Android Smartphone and tablet and apple I Pad, which is why touch panel display is getting approved. However, the unavailability of raw materials such as indium tin oxide and the high cost of the multi-touch screen can act as major obstacles for the growth of its market share.
High investment required for the production of multi-touch screen display and the huge competition among industry players can further increase its sales. This technology has many advantages, such as to operate the touch screens with the help of technologies like images, video, text, satellite images and 3D simulations with different gestures at random. There is a possibility of new and emerging advertising, retail and media applications that will support the growth of the multi-touch screen market growth in the future. In essence, the combination of multi-touch technology with imaging technology is also known as video calling, which will influence the multi-touch screen market trends positively throughout the prediction period.
REGIONAL ANALYSIS
The North American region dominated the multi-touch screen business in 2018. This region is anticipated to grow at a CAGR of about 11.5% during the forecast period. Further, the Asia Pacific region is expected to enhance market growth with a CAGR of around 25.8% in the coming few years.
SEGMENT ANALYSIS
In terms of application, the market has been segmented as the Government, Enterprise, Retail, Industrial, Medical, Military, and Commercial. Based on technology, the segmentation has been done as Optical, Infrared, Resistive, Acoustic and Capacitive. Based on the device, the multi-touch screen market report provides a detailed analysis of Gaming systems, POS Systems, Smartphone’s, Tablets, Large Displays, and Television. Also, wearable smart devices and watches use the multi-touch screen to provide a better experience to the users. Thus increasing demand for portable electronic devices and smart wearable devices increases the demand for the multi-touch screen.
INDUSTRY PLAYER ANALYSIS
Major industry players have been analyzed with emphasis on their operating areas, revenues, and other strategic aspects. These players include DISPLAX Interactive Systems, 3M Company, Microsoft Corporation, Wintek Corporation, Freescale Gigabyte, Samsung, LG Display, Fujitsu Limited, Cypress Semiconductor Corporation, Atmel Corporation, and Synaptic Incorporated. Other industries in this domain that is growing at a high CAGR include Newborn Screening Software Market and Touch Screen Display Market.
COVERAGE HIGHLIGHTS
Revenue Estimation and Forecast (2018 – 2026)
Production Estimation and Forecast (2018 – 2026)
Sales/Consumption Volume Estimation and Forecast (2018 – 2026)
Breakdown of Revenue by Segments (2018 – 2026)
Breakdown of Production by Segments (2018 – 2026)
Breakdown of Sales Volume by Segments (2018 – 2026)
Gross Margin and Profitability Analysis of Companies
Business Trend and Expansion Analysis
Import and Export Analysis
Regional Analysis and Data Breakdown
SEGMENTAL ANALYSIS:
By Technology Overlook ($Revenue and Unit Sales, 2018-2026)
Optical
Infrared
Resistive
Acoustic
Capacitive
By Application Outlook ($Revenue and Unit Sales, 2018-2026)
Government
Enterprise
Retail
Industrial
Medical
Military
Commercial
By Device Outlook ($Revenue and Unit Sales, 2018-2026)
Gaming systems
POS Systems
Smartphone
Tablets
Large Displays
Television
By Geographical Outlook ($Revenue and Unit Sales, 2018-2026)
North America
Mexico
U.S
Canada
Europe
France
U.K
Germany
Russia
Italy
Rest of Europe
Asia-Pacific
South Korea
India
Japan
China
Rest of Asia-Pacific
Rest of the World
Middle East
Africa
INDUSTRY PLAYER ANALYSIS:
• DISPLAX Interactive Systems
• 3M Company
• Microsoft Corporation
• Wintek Corporation
• Freescale Gigabyte
• Samsung, LG Display
• Fujitsu Limited
• Cypress Semiconductor Corporation
• Atmel Corporation
• Synaptic Incorporated
CHAPTER 1. INTRODUCTION
1.1. RESEARCH METHODOLOGY
1.1.1. Data Collection
1.1.2. Data Modeling
1.1.3. Historical Revenue and Sales Estimation
1.1.4. Data Triangulation
1.2. RESEARCH PROCESS
1.2.1. Primary Research
1.2.2. Secondary Research
1.2.3. Survey Data
1.2.4. Validation by In-House Expert
1.3.MULTI TOUCH SCREEN MARKET OVERVIEW
1.3.1. Research Scope and Market Definition
1.3.2. Executive Summary
CHAPTER 2.GLOBAL
MULTI TOUCH SCREEN MARKET DEMAND SIDE ANALYSIS
2.1.MULTI TOUCH SCREEN MARKET CONSUMPTION VOLUME (MILLION UNITS), 2018 – 2025
2.2. MARKET CONSUMPTION VOLUME SPLIT BY REGION (MILLION UNITS), 2018 – 2025
2.3. MARKET CONSUMPTION VOLUME SPLIT BY COUNTRIES (MILLION UNITS), 2018 – 2025
2.4. MARKET REVENUE (MILLION USD), 2018-2025
2.5. MARKET REVENUE SPLIT BY REGION (MILLION UNITS), 2018 – 2025
2.6. MULTI TOUCH SCREEN MARKET REVENUE SPLIT BY COUNTRIES (MILLION UNITS), 2018 – 2025
CHAPTER 3. GLOBAL MULTI TOUCH SCREEN MARKET PRODUCTION VOLUME (MILLION UNITS), 2018 – 2025
3.2. MARKET PRODUCTION VOLUME SPLIT BY REGION (MILLION UNITS), 2018-2025
3.3. MARKET PRODUCTION VOLUME SPLIT/RANKING BY COUNTRIES (MILLION UNITS), 2018 – 2025MULTI TOUCH SCREEN MARKET SUPPLY SIDE ANALYSIS
3.1.
CHAPTER 4. GLOBAL MULTI TOUCH SCREEN MARKET COMPETITIVE SCENARIO & BUSINESS OPPORTUNITY ANALYSIS
4.1. COMPETITIVE STRENGTH RANKING BY MAJOR COUNTRIES, 2018
4.2. MARKET ATTRACTIVENESS RANKING BY MAJOR COUNTRIES, 2018 - 2025
4.3. EMERGING BUSINESS OPPORTUNITIES AND GROWTH PROSPECTS
4.3.1. Growth Drivers
4.3.2. Market Restraints
4.3.2. Opportunities
CHAPTER 5. GLOBAL MULTI TOUCH SCREEN MARKET ENTRY STRATEGIES
5.1. ENTRY STRATEGIES IN DEVELOPING MARKETS
5.2. ENTRY STRATEGIES IN DEVELOPED MARKETS
CHAPTER 6. GLOBAL MULTI TOUCH SCREEN MARKET BY TECHNOLOGY
6.1. SEGMENT OUTLINE
6.2. REVENUE SHARE BY TECHNOLOGY, $MILION, 2018 – 2025
6.2. CONSUMPTION SHARE BY TECHNOLOGY, MILLION UNITS, 2018 - 2025
6.3. PRODUCTION SHARE BY TECHNOLOGY, MILLION UNITS, 2018 – 2025
6.4. OPTICAL
6.4.1. Market determinants and trend analysis
6.4.2. Market revenue, sales and production volume, 2018 – 2025
6.5. INFRARED
6.5.1. Market determinants and trend analysis
6.5.2. Market revenue, sales and production volume, 2018 – 2025
6.6. RESISTIVE
6.6.1. Market determinants and trend analysis
6.6.2. Market revenue, sales and production volume, 2018 – 2025
6.7. ACOUSTIC
6.7.1. Market determinants and trend analysis
6.7.2. Market revenue, sales and production volume, 2018 – 2025
6.8. CAPACITIVE
6.8.1. Market determinants and trend analysis
6.8.2. Market revenue, sales and production volume, 2018 – 2025
CHAPTER 7. GLOBALMULTI TOUCH SCREEN MARKET BY APPLICATION
7.1. SEGMENT OUTLINE
7.2. REVENUE SHARE BY APPLICATION, $MILION, 2018 – 2025
7.2. CONSUMPTION SHARE BY APPLICATION, MILLION UNITS, 2018 - 2025
7.3. PRODUCTION SHARE BY APPLICATION, MILLION UNITS, 2018 – 2025
7.4. GOVERNMENT
7.4.1. Market determinants and trend analysis
7.4.2. Market revenue, sales and production volume, 2018 – 2025
7.5. ENTERPRISE
7.5.1. Market determinants and trend analysis
7.5.2. Market revenue, sales and production volume, 2018 – 2025
7.6. RETAIL
7.6.1. Market determinants and trend analysis
7.6.2. Market revenue, sales and production volume, 2018 – 2025
7.7. INDUSTRIAL
7.7.1. Market determinants and trend analysis
7.7.2. Market revenue, sales and production volume, 2018 – 2025
7.8. MEDICAL
7.8.1. Market determinants and trend analysis
7.8.2. Market revenue, sales and production volume, 2018 – 2025
7.9. MILITARY
7.9.1. Market determinants and trend analysis
7.9.2. Market revenue, sales and production volume, 2018 – 2025
7.10. COMMERCIAL
7.10.1. Market determinants and trend analysis
7.10.2. Market revenue, sales and production volume, 2018 – 2025
CHAPTER 8. GLOBALMULTI TOUCH SCREEN MARKET BY DEVICE
8.1. SEGMENT OUTLINE
8.2. REVENUE SHARE BY DEVICE, $MILION, 2018 – 2025
8.2. CONSUMPTION SHARE BY DEVICE, MILLION UNITS, 2018 - 2025
8.3. PRODUCTION SHARE BY DEVICE, MILLION UNITS, 2018 – 2025
8.4. GAMING SYSTEMS
8.4.1. Market determinants and trend analysis
8.4.2. Market revenue, sales and production volume, 2018 – 2025
8.5. POS SYSTEMS
8.5.1. Market determinants and trend analysis
8.5.2. Market revenue, sales and production volume, 2018 – 2025
8.6. SMARTPHONE
8.6.1. Market determinants and trend analysis
8.6.2. Market revenue, sales and production volume, 2018 – 2025
8.7. TABLETS
8.7.1. Market determinants and trend analysis
8.7.2. Market revenue, sales and production volume, 2018 – 2025
8.8. LARGE DISPLAYS
8.8.1. Market determinants and trend analysis
8.8.2. Market revenue, sales and production volume, 2018 – 2025
8.9. TELEVISION
8.9.1. Market determinants and trend analysis
8.9.2. Market revenue, sales and production volume, 2018 – 2025
CHAPTER 9. GLOBALMULTI TOUCH SCREEN MARKET BY REGIONS
9.1. REGIONAL OUTLOOK
9.2. MARKET PRODUCTION, CONSUMPTION & REVENUE BY REGION, 2018-2025
9.3. NORTH AMERICA
9.3.1. Current Trends and Future Prospects
9.3.2. North America market revenue, sales and production volume, 2018 – 2025
9.3.3.U.S.
9.3.3.1.Multi Touch Screen Market Revenue $Million (2018 – 2025)
9.3.3.2.Multi Touch Screen Market Consumption Million Units (2018 – 2025)
9.3.3.3.Multi Touch Screen Market Production Million Units (2018 – 2025)
9.3.4. Canada
9.3.4.1.Multi Touch Screen Market Revenue $Million (2018 – 2025)
9.3.4.2.Multi Touch Screen Market Consumption Million Units (2018 – 2025)
9.3.4.3.Multi Touch Screen Market Production Million Units (2018 – 2025)
9.3.5. Mexico
9.3.5.1.Multi Touch Screen Market Revenue $Million (2018 – 2025)
9.3.5.2.Multi Touch Screen Market Consumption Million Units (2018 – 2025)
9.3.5.3.Multi Touch Screen Market Production Million Units (2018 – 2025)
9.4. EUROPE
9.4.1. Current Trends and Future Prospects
9.4.2. Europe market revenue, sales and production volume, 2018 – 2025
9.4.3. U.K
9.4.3.1. Multi Touch Screen Market Revenue $Million (2018 – 2025)
9.4.3.2. Multi Touch Screen Market Consumption Million Units (2018 – 2025)
9.4.3.3. Multi Touch Screen Market Production Million Units (2018 – 2025)
9.4.4. Germany
9.4.4.1. Multi Touch Screen Market Revenue $Million (2018 – 2025)
9.4.4.2. Multi Touch Screen Market Consumption Million Units (2018 – 2025)
9.4.4.3. Multi Touch Screen Market Production Million Units (2018 – 2025)
9.4.5. France
9.4.5.1.Multi Touch Screen Market Revenue $Million (2018 – 2025)
9.4.5.2.Multi Touch Screen Market Consumption Million Units (2018 – 2025)
9.4.5.3.Multi Touch Screen Market Production Million Units (2018 – 2025)
9.4.6. Italy
9.4.6.1. Multi Touch Screen Market Revenue $Million (2018 – 2025)
9.4.6.2. Multi Touch Screen Market Consumption Million Units (2018 – 2025)
9.4.6.3. Multi Touch Screen Market Production Million Units (2018 – 2025)
9.4.7. Rest of Europe
9.4.7.1. Multi Touch Screen Market Revenue $Million (2018 – 2025)
9.4.7.2. Multi Touch Screen Market Consumption Million Units (2018 – 2025)
9.4.7.3. Multi Touch Screen Market Production Million Units (2018 – 2025)
9.5. ASIA PACIFIC
9.5.1. Current Trends and Future Prospects
9.5.2. Europe market revenue, sales and production volume, 2018 – 2025
9.5.3. India
9.5.3.1.Multi Touch Screen Market Revenue $Million (2018 – 2025)
9.5.3.2.Multi Touch Screen Market Consumption Million Units (2018 – 2025)
9.5.3.3.Multi Touch Screen Market Production Million Units (2018 – 2025)
9.5.4. Japan
9.5.4.1. Multi Touch Screen Market Revenue $Million (2018 – 2025)
9.5.4.2. Multi Touch Screen Market Consumption Million Units (2018 – 2025)
9.5.4.3. Multi Touch Screen Market Production Million Units (2018 – 2025)
9.5.5. China
9.5.5.1.Multi Touch Screen Market Revenue $Million (2018 – 2025)
9.5.5.2.Multi Touch Screen Market Consumption Million Units (2018 – 2025)
9.5.5.3.Multi Touch Screen Market Production Million Units (2018 – 2025)
9.5.6. South Korea
9.5.6.1.Multi Touch Screen Market Revenue $Million (2018 – 2025)
9.5.6.2.Multi Touch Screen Market Consumption Million Units (2018 – 2025)
9.5.6.3. Multi Touch Screen Market Production Million Units (2018 – 2025)
9.5.7. Rest of APAC
9.5.7.1. Multi Touch Screen Market Revenue $Million (2018 – 2025)
9.5.7.2. Multi Touch Screen Market Consumption Million Units (2018 – 2025)
9.5.7.3. Multi Touch Screen Market Production Million Units (2018 – 2025)
9.6. REST OF THE WORLD
9.6.1. Current Trends and Future Prospects
9.6.2. Europe market revenue, sales and production volume, 2018 – 2025
9.6.3. Latin America
9.6.3.1. Multi Touch Screen Market Revenue $Million (2018 – 2025)
9.6.3.2. Multi Touch Screen Market Consumption Million Units (2018 – 2025)
9.6.3.3. Multi Touch Screen Market Production Million Units (2018 – 2025)
9.6.4. Middle East
9.6.4.1.Multi Touch Screen Market Revenue $Million (2018 – 2025)
9.6.4.2.Multi Touch Screen Market Consumption Million Units (2018 – 2025)
9.6.4.3.Multi Touch Screen Market Production Million Units (2018 – 2025)
9.6.5. Africa
9.6.5.1. Multi Touch Screen Market Revenue $Million (2018 – 2025)
9.6.5.2. Multi Touch Screen Market Consumption Million Units (2018 – 2025)
9.6.5.3. Multi Touch Screen Market Production Million Units (2018 – 2025)
CHAPTER 10. KEY VENDOR PROFILES
10.1. DISPLAX Interactive Systems
10.1.1. Company overview
10.1.2. Portfolio Analysis
10.1.3. Estimated revenue from
multi touch screen business and market share
10.1.4. Regional & business segment Revenue Analysis
10.2. 3M Microsoft Corporation
10.2.1. Company overview
10.2.2. Portfolio Analysis
10.2.3. Estimated revenue from multi touch screen business and market share
10.2.4. Regional & business segment Revenue Analysis
10.3. Microsoft Corporation
10.3.1. Company overview
10.3.2. Portfolio Analysis
10.3.3. Estimated revenue from multi touch screen business and market share
10.3.4. Regional & business segment Revenue Analysis
10.4. Wintek Corporation
10.4.1. Company overview
10.4.2. Portfolio Analysis
10.4.3. Estimated revenue from multi touch screen business and market share
10.4.4. Regional & business segment Revenue Analysis
10.5. Freescale Gigabyte
10.5.1. Company overview
10.5.2. Portfolio Analysis
10.5.3. Estimated revenue from multi touch screen business and market share
10.5.4. Regional & business segment Revenue Analysis
10.6. Samsung
10.6.1. Company overview
10.6.2. Portfolio Analysis
10.6.3. Estimated revenue from multi touch screen business and market share
10.6.4. Regional & business segment Revenue Analysis
10.7. LG Display
10.7.1. Company overview
10.7.2. Portfolio Analysis
10.7.3. Estimated revenue from multi touch screen business and market share
10.7.4. Regional & business segment Revenue Analysis
10.8. Fujitsu Limited
10.8.1. Company overview
10.8.2. Portfolio Analysis
10.8.3. Estimated revenue from multi touch screen business and market share
10.8.4. Regional & business segment Revenue Analysis
10.9. Cypress Semiconductor Corporation
10.9.1. Company overview
10.9.2. Portfolio Analysis
10.9.3. Estimated revenue from multi touch screen business and market share
10.9.4. Regional & business segment Revenue Analysis
10.10. Atmel Corporation
10.10.1. Company overview
10.10.2. Portfolio Analysis
10.10.3. Estimated revenue from multi touch screen business and market share
10.10.4. Regional & business segment Revenue Analysis
10.11. Synaptic Incorporated
10.11.1. Company overview
10.11.2. Portfolio Analysis
10.11.3. Estimated revenue from multi touch screen business and market share
10.11.4. Regional & business segment Revenue Analysis
PURCHASE OPTIONS
20% Free Customization ON ALL PURCHASE
*Terms & Conditions Apply
Looking for report on this market in a particular region or country? Get In Touch
Request Free Sample
Please fill in the form below to Request for free Sample Report
-
Office Hours Mon - Sat 10:00 - 16:00
-
Call Us +91 6201075429
-
Send Us Mail sales@marketdecipher.com
Market Decipher is a market research and consultancy firm involved in provision of market reports to organisations of varied sizes; small, large and medium.

© 2018 Market Decipher. All Rights Reserved