Photoelectric Sensors Market Revenue, Sales Volume & Trend Forecasts Report, 2019-2026
By Technology (Retro-Reflective, Diffused, Thru-Beam), By End-Use (Aerospace and Military, Automotive, Packaging, Electronics, and Semiconductor), By Region (North America, Europe, APAC and Rest of the World)
- Report ID : MD1045 |
- Pages : 91 |
- Tables : 84 |
- Formats :


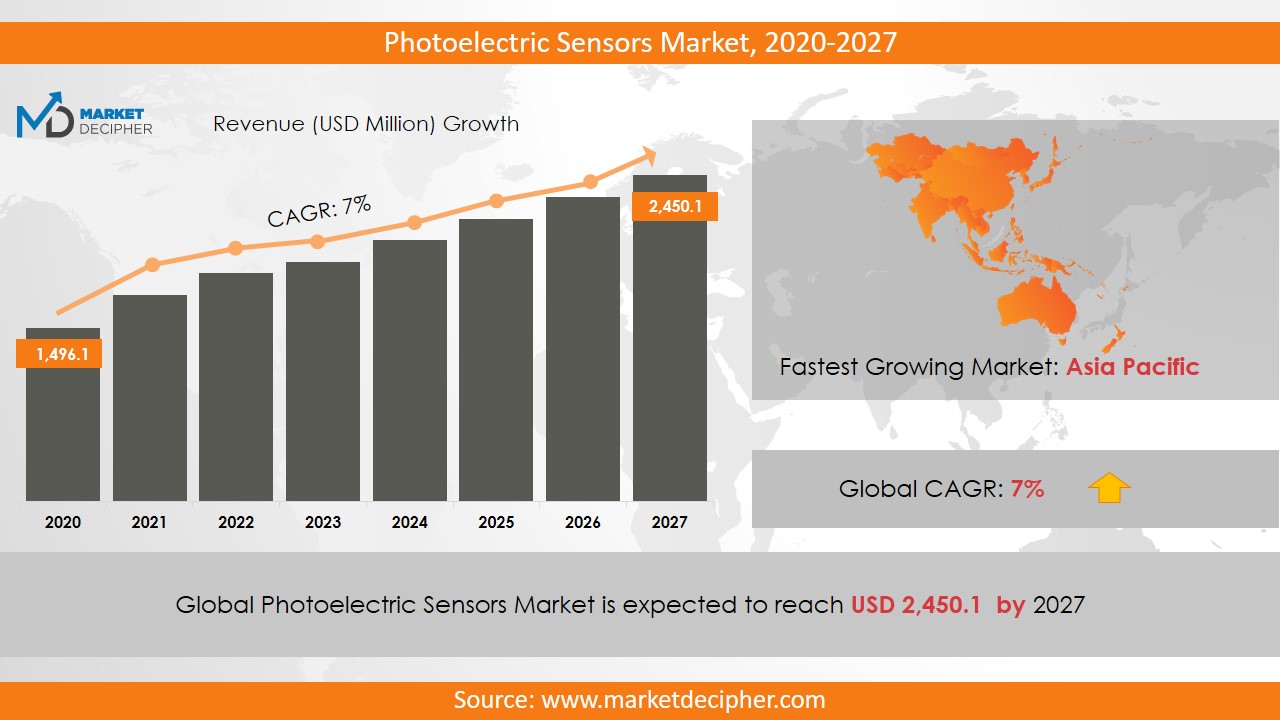
The market revenue of Photoelectric Sensors shall reach a value of $2.34 Billion in 2026, growing with a CAGR of 4.2% during the forecast period of 2018 to 2026. In terms of volume sales, the market is anticipated to reach XX Units.
A photoelectric sensor emits a light beam from its light-emitting element and is used to detect the light ray reflected from the source. Some sensors are additionally used to detect the amount of light emitted. Increasing the use of these sensors in packaging, manufacturing, and material holding tasks is leading the industry to grow notably. They enhance the operational efficiency and productivity of manufacturing industries leading to an increase in their market sales. Apart from this, they are also light in weight and very facile to carry. Further, the cost of installation and maintenance of these sensors is affordable due to which there will be an immense increase in their market size during the forecast period.
Extensive application of these sensors in different sectors such as throttle control, failure diagnosis, etc. are the factors that are anticipated to support their market growth. The government of various countries is implementing stringent rules and regulations to enhance the use of photoelectric sensors in industries, thereby increasing their market share.
REGIONAL ANALYSIS:
The Asia Pacific region has contributed to about 36% of the overall market revenue in 2018 owing to the increasing adoption of the Internet of Things in the region. Further, this region is anticipated to grow at a CAGR of 6.8% over the forecast period. The Europe region has also contributed substantially to the augmenting market share due to the strict government rules and regulations to adopt these sensors in the region.
SEGMENTAL ANALYSIS:
In terms of technology, the segmentation has been done as retro-reflective, diffused and thru-beam. The retro-reflective segment dominated the photoelectric sensors industry in terms of revenue. Based on end-use, these sensors find their comprehensive application in aerospace and military, automotive, packaging, electronics and semiconductors. The automotive segment has registered to account for the largest share of the market in 2018. The affordable cost of these sensors and their adoption rules are contributing immensely to the development of the market.
Retro-Reflective Segment is responsible for the maximum revenue generation in 2018 and is expected to grow at the highest rate in the coming few years. This technology has very low maintenance and installation cost and is capable of detecting transparent objects and are also used to detect automobiles in crowded places and enables advanced electronic power steering system to detect shiny objects. Moreover, the diffused segment is expected to generate substantial revenue during the forecast period. In 2018, the automotive segment acquired a big stake in the photoelectric sensor market revenue.
INDUSTRY PLAYERS ANALYSIS:
Major industry players have been analyzed based on their operating areas, revenues, and other strategic aspects. Also, few key industry players are playing a vital role in increasing market revenue by investing heavily in this market over the last few years. These players include Panasonic Corporation, Keyence Corporation, Autonics Corporation, Rockwell Automation Incorporated, Schneider Electric SE, Avago Corporation, Eaton Corporation PLC, IFM Electronics Limited, Omron Corporation, and Balluf Incorporated. Other industries in this domain that are growing at a high CAGR include Collision Avoidance Sensors Market and Industrial Inclination Sensors Market.
COVERAGE HIGHLIGHTS
• Revenue Estimation and Forecast (2018 – 2026)
• Production Estimation and Forecast (2018 – 2026)
• Sales/Consumption Volume Estimation and Forecast (2018 – 2026)
• Breakdown of Revenue by Segments (2018 – 2026)
• Breakdown of Production by Segments (2018 – 2026)
• Breakdown of Sales Volume by Segments (2018 – 2026)
• Gross Margin and Profitability Analysis of Companies
• Business Trend and Expansion Analysis
• Import and Export Analysis
• Regional Analysis and Data Breakdown
SEGMENTAL ANALYSIS:
By Technology Outlook ($Revenue and Unit Sales, 2018-2026)
• Retro-Reflective
• Diffused
• Thru-Beam
By End-Use Outlook ($Revenue and Unit Sales, 2018-2026)
• Aerospace and Military
• Automotive
• Packaging
• Electronics and Semiconductor
By Regional Outlook ($Revenue and Unit Sales, 2018-2026)
• North America
• Canada
• U.S
• Mexico
• Europe
• Germany
• France
• U.K
• Rest of Europe
• Asia-Pacific
• China
• India
• Japan
• Rest of Asia Pacific
• Rest of the World
• Middle East
• Africa
• Latin America
INDUSTRY PLAYERS ANALYSIS:
• Panasonic Corporation
• Keyence Corporation
• Autonics Corporation
• Rockwell Automation Incorporated
• Schneider Electric SE
• Avago Corporation
• Eaton Corporation PPL
• IFM Electronics Limited
• Omron Corporation
• Balluf Incorporated
CHAPTER 1. INTRODUCTION
1.1. RESEARCH METHODOLOGY
1.1.1. Data Collection
1.1.2. Data Modeling
1.1.3. Historical Revenue and Sales Estimation
1.1.4. Data Triangulation
1.2. RESEARCH PROCESS
1.2.1. Primary Research
1.2.2. Secondary Research
1.2.3. Survey Data
1.2.4. Validation by In-House Expert
1.3. PHOTOELECTRIC SENSORS MARKET OVERVIEW
1.3.1. Research Scope and Market Definition
1.3.2. Executive Summary
CHAPTER 2. GLOBAL PHOTOELECTRIC SENSORS MARKET DEMAND SIDE ANALYSIS
2.1. PHOTOELECTRIC SENSORS MARKET CONSUMPTION VOLUME (BILLION UNITS), 2018 – 2025
2.2. MARKET CONSUMPTION VOLUME SPLIT BY REGION (BILLION UNITS), 2018 – 2025
2.3. MARKET CONSUMPTION VOLUME SPLIT BY COUNTRIES (BILLION UNITS), 2018 – 2025
2.4. MARKET REVENUE (BILLION USD), 2018-2025
2.5. MARKET REVENUE SPLIT BY REGION (BILLION UNITS), 2018 – 2025
2.6. PHOTOELECTRIC SENSORS MARKET REVENUE SPLIT BY COUNTRIES (BILLION UNITS), 2018 – 2025
CHAPTER 3. GLOBAL PHOTOELECTRIC SENSORS MARKET SUPPLY SIDE ANALYSIS
3.1. PHOTOELECTRIC SENSORS MARKET PRODUCTION VOLUME (BILLION UNITS), 2018 – 2025
3.2. MARKET PRODUCTION VOLUME SPLIT BY REGION (BILLION UNITS), 2018-2025
3.3. MARKET PRODUCTION VOLUME SPLIT/RANKING BY COUNTRIES (BILLION UNITS), 2018 – 2025
CHAPTER 4. GLOBAL PHOTOELECTRIC SENSORS MARKET COMPETITIVE SCENARIO & BUSINESS OPPORTUNITY ANALYSIS
4.1. COMPETITIVE STRENGTH RANKING BY MAJOR COUNTRIES, 2018
4.2. MARKET ATTRACTIVENESS RANKING BY MAJOR COUNTRIES, 2018 - 2025
4.3. EMERGING BUSINESS OPPORTUNITIES AND GROWTH PROSPECTS
4.3.1. Growth Drivers
4.3.2. Market Restraints
4.3.2. Opportunities
CHAPTER 5. GLOBAL PHOTOELECTRIC SENSORS MARKET ENTRY STRATEGIES
5.1. ENTRY STRATEGIES IN DEVELOPING MARKETS
5.2. ENTRY STRATEGIES IN DEVELOPED MARKETS
CHAPTER 6. GLOBAL PHOTOELECTRIC SENSORS MARKET BY TECHNOLOGY
6.1. SEGMENT OUTLINE
6.2. REVENUE SHARE BY TECHNOLOGY, $BILLION, 2018 – 2025
6.2. CONSUMPTION SHARE BY TECHNOLOGY, BILLION UNITS, 2018 - 2025
6.3. PRODUCTION SHARE BY TECHNOLOGY, BILLION UNITS, 2018 – 2025
6.4. RETRO-REFLECTIVE
6.4.1. Market determinants and trend analysis
6.4.2. Market revenue, sales and production volume, 2018 – 2025
6.5. DIFFUSED
6.5.1. Market determinants and trend analysis
6.5.2. Market revenue, sales and production volume, 2018 – 2025
6.6. THRU-BEAM
6.6.1. Market determinants and trend analysis
6.6.2. Market revenue, sales and production volume, 2018 – 2025
CHAPTER 7. GLOBAL PHOTOELECTRIC SENSORS MARKET BY END-USE
7.1. SEGMENT OUTLINE
7.2. REVENUE SHARE BY END-USE, $BILLION, 2018 – 2025
7.2. CONSUMPTION SHARE BY END-USE, BILLION UNITS, 2018 - 2025
7.3. PRODUCTION SHARE BY END-USE, BILLION UNITS, 2018 – 2025
7.4. AEROSPACE AND MILITARY
7.4.1. Market determinants and trend analysis
7.4.2. Market revenue, sales and production volume, 2018 – 2025
7.5. AUTOMOTIVE
7.5.1. Market determinants and trend analysis
7.5.2. Market revenue, sales and production volume, 2018 – 2025
7.6. PACKAGING
7.6.1. Market determinants and trend analysis
7.6.2. Market revenue, sales and production volume, 2018 – 2025
7.7. ELECTRONICS AND SEMICONDUCTOR
7.7.1. Market determinants and trend analysis
7.7.2. Market revenue, sales and production volume, 2018 – 2025
CHAPTER 8. GLOBAL PHOTOELECTRIC SENSORS MARKET BY REGIONS
8.1. REGIONAL OUTLOOK
8.2. MARKET PRODUCTION, CONSUMPTION & REVENUE BY REGION, 2018-2025
8.3. NORTH AMERICA
8.3.1. Current Trends and Future Prospects
8.3.2. North America market revenue, sales and production volume, 2018 – 2025
8.3.3. U.S.
8.3.3.1. Photoelectric Sensors Market Revenue $BILLION (2018 – 2025)
8.3.3.2. Photoelectric Sensors Market Consumption BILLION Units (2018 – 2025)
8.3.3.3. Photoelectric Sensors Market Production BILLION Units (2018 – 2025)
8.3.4. Canada
8.3.4.1. Photoelectric Sensors Market Revenue $BILLION (2018 – 2025)
8.3.4.2. Photoelectric Sensors Market Consumption BILLION Units (2018 – 2025)
8.3.4.3. Photoelectric Sensors Market Production BILLION Units (2018 – 2025)
8.3.5. Mexico
8.3.5.1. Photoelectric Sensors Market Revenue $BILLION (2018 – 2025)
8.3.5.2. Photoelectric Sensors Market Consumption BILLION Units (2018 – 2025)
8.3.5.3. Photoelectric Sensors Market Production BILLION Units (2018 – 2025)
8.4. EUROPE
8.4.1. Current Trends and Future Prospects
8.4.2. Europe market revenue, sales and production volume, 2018 – 2025
8.4.3. U.K
8.4.3.1. Photoelectric Sensors Market Revenue $BILLION (2018 – 2025)
8.4.3.2. Photoelectric Sensors Market Consumption BILLION Units (2018 – 2025)
8.4.3.3. Photoelectric Sensors Market Production BILLION Units (2018 – 2025)
8.4.4. Germany
8.4.4.1. Photoelectric Sensors Market Revenue $BILLION (2018 – 2025)
8.4.4.2. Photoelectric Sensors Market Consumption BILLION Units (2018 – 2025)
8.4.4.3. Photoelectric Sensors Market Production BILLION Units (2018 – 2025)
8.4.5. France
8.4.5.1. Photoelectric Sensors Market Revenue $BILLION (2018 – 2025)
8.4.5.2. Photoelectric Sensors Market Consumption BILLION Units (2018 – 2025)
8.4.5.3. Photoelectric Sensors Market Production BILLION Units (2018 – 2025)
8.4.6. Italy
8.4.6.1. Photoelectric Sensors Market Revenue $BILLION (2018 – 2025)
8.4.6.2. Photoelectric Sensors Market Consumption BILLION Units (2018 – 2025)
8.4.6.3. Photoelectric Sensors Market Production BILLION Units (2018 – 2025)
8.4.7. Rest of Europe
8.4.7.1. Photoelectric Sensors Market Revenue $BILLION (2018 – 2025)
8.4.7.2. Photoelectric Sensors Market Consumption BILLION Units (2018 – 2025)
8.4.7.3. Photoelectric Sensors Market Production BILLION Units (2018 – 2025)
8.5. ASIA PACIFIC
8.5.1. Current Trends and Future Prospects
8.5.2. Europe market revenue, sales and production volume, 2018 – 2025
8.5.3. India
8.5.3.1. Photoelectric Sensors Market Revenue $BILLION (2018 – 2025)
8.5.3.2. Photoelectric Sensors Market Consumption BILLION Units (2018 – 2025)
8.5.3.3. Photoelectric Sensors Market Production BILLION Units (2018 – 2025)
8.5.4. Japan
8.5.4.1. Photoelectric Sensors Market Revenue $BILLION (2018 – 2025)
8.5.4.2. Photoelectric Sensors Market Consumption BILLION Units (2018 – 2025)
8.5.4.3. Photoelectric Sensors Market Production BILLION Units (2018 – 2025)
8.5.5. China
8.5.5.1. Photoelectric Sensors Market Revenue $BILLION (2018 – 2025)
8.5.5.2. Photoelectric Sensors Market Consumption BILLION Units (2018 – 2025)
8.5.5.3. Photoelectric Sensors Market Production BILLION Units (2018 – 2025)
8.5.6. South Korea
8.5.6.1. Photoelectric Sensors Market Revenue $BILLION (2018 – 2025)
8.5.6.2. Photoelectric Sensors Market Consumption BILLION Units (2018 – 2025)
8.5.6.3. Photoelectric Sensors Market Production BILLION Units (2018 – 2025)
8.5.7. Rest of APAC
8.5.7.1. Photoelectric Sensors Market Revenue $BILLION (2018 – 2025)
8.5.7.2. Photoelectric Sensors Market Consumption BILLION Units (2018 – 2025)
8.5.7.3. Photoelectric Sensors Market Production BILLION Units (2018 – 2025)
8.6. REST OF THE WORLD
8.6.1. Current Trends and Future Prospects
8.6.2. Europe market revenue, sales and production volume, 2018 – 2025
8.6.3. Latin America
8.6.3.1. Photoelectric Sensors Market Revenue $BILLION (2018 – 2025)
8.6.3.2. Photoelectric Sensors Market Consumption BILLION Units (2018 – 2025)
8.6.3.3. Photoelectric Sensors Market Production BILLION Units (2018 – 2025)
8.6.4. Middle East
8.6.4.1. Photoelectric Sensors Market Revenue $BILLION (2018 – 2025)
8.6.4.2. Photoelectric Sensors Market Consumption BILLION Units (2018 – 2025)
8.6.4.3. Photoelectric Sensors Market Production BILLION Units (2018 – 2025)
8.6.5. Africa
8.6.5.1. Photoelectric Sensors Market Revenue $BILLION (2018 – 2025)
8.6.5.2. Photoelectric Sensors Market Consumption BILLION Units (2018 – 2025)
8.6.5.3. Photoelectric Sensors Market Production BILLION Units (2018 – 2025)
CHAPTER 9. KEY VENDOR PROFILES
9.1. Panasonic Corporation
9.1.1. Company overview
9.1.2. Portfolio Analysis
9.1.3. Estimated revenue from photoelectric sensors business and market share
9.1.4. Regional & business segment Revenue Analysis
9.2. Keyence Corporation
9.2.1. Company overview
9.2.2. Portfolio Analysis
9.2.3. Estimated revenue from photoelectric sensors business and market share
9.2.4. Regional & business segment Revenue Analysis
9.3. Autonics Corporation
9.3.1. Company overview
9.3.2. Portfolio Analysis
9.3.3. Estimated revenue from photoelectric sensors business and market share
9.3.4. Regional & business segment Revenue Analysis
9.4. Rockwell Automation Incorporated
9.4.1. Company overview
9.4.2. Portfolio Analysis
9.4.3. Estimated revenue from photoelectric sensors business and market share
9.4.4. Regional & business segment Revenue Analysis
9.5. Schneider Electric SE
9.5.1. Company overview
9.5.2. Portfolio Analysis
9.5.3. Estimated revenue from photoelectric sensors business and market share
9.5.4. Regional & business segment Revenue Analysis
9.6. Avago Corporation
9.6.1. Company overview
9.6.2. Portfolio Analysis
9.6.3. Estimated revenue from photoelectric sensors business and market share
9.6.4. Regional & business segment Revenue Analysis
9.7. Eaton Corporation PLC
9.7.1. Company overview
9.7.2. Portfolio Analysis
9.7.3. Estimated revenue from photoelectric sensors business and market share
9.7.4. Regional & business segment Revenue Analysis
9.8. IFM Electronics Limited
9.8.1. Company overview
9.8.2. Portfolio Analysis
9.8.3. Estimated revenue from photoelectric sensors business and market share
9.8.4. Regional & business segment Revenue Analysis
9.9. Omron Corporation
9.9.1. Company overview
9.9.2. Portfolio Analysis
9.9.3. Estimated revenue from photoelectric sensors business and market share
9.9.4. Regional & business segment Revenue Analysis
9.10. Balluf Incorporated
9.10.1. Company overview
9.10.2. Portfolio Analysis
9.10.3. Estimated revenue from photoelectric sensors business and market share
9.10.4. Regional & business segment Revenue Analysis
PURCHASE OPTIONS
20% Free Customization ON ALL PURCHASE
*Terms & Conditions Apply
Looking for report on this market in a particular region or country? Get In Touch
Request Free Sample
Please fill in the form below to Request for free Sample Report
-
Office Hours Mon - Sat 10:00 - 16:00
-
Call Us +91 6201075429
-
Send Us Mail sales@marketdecipher.com
Market Decipher is a market research and consultancy firm involved in provision of market reports to organisations of varied sizes; small, large and medium.

© 2018 Market Decipher. All Rights Reserved