Smart Scale Market Revenue, Sales Volume & Trend Forecasts Report, 2019-2026
Smart Scale Market By Type (Glass and Steel), By Application (Object weighing and Body mass weighing), By Region (North America, Europe, APAC and Rest of the World)
- Report ID : MD1138 |
- Pages : 195 |
- Tables : 87 |
- Formats :


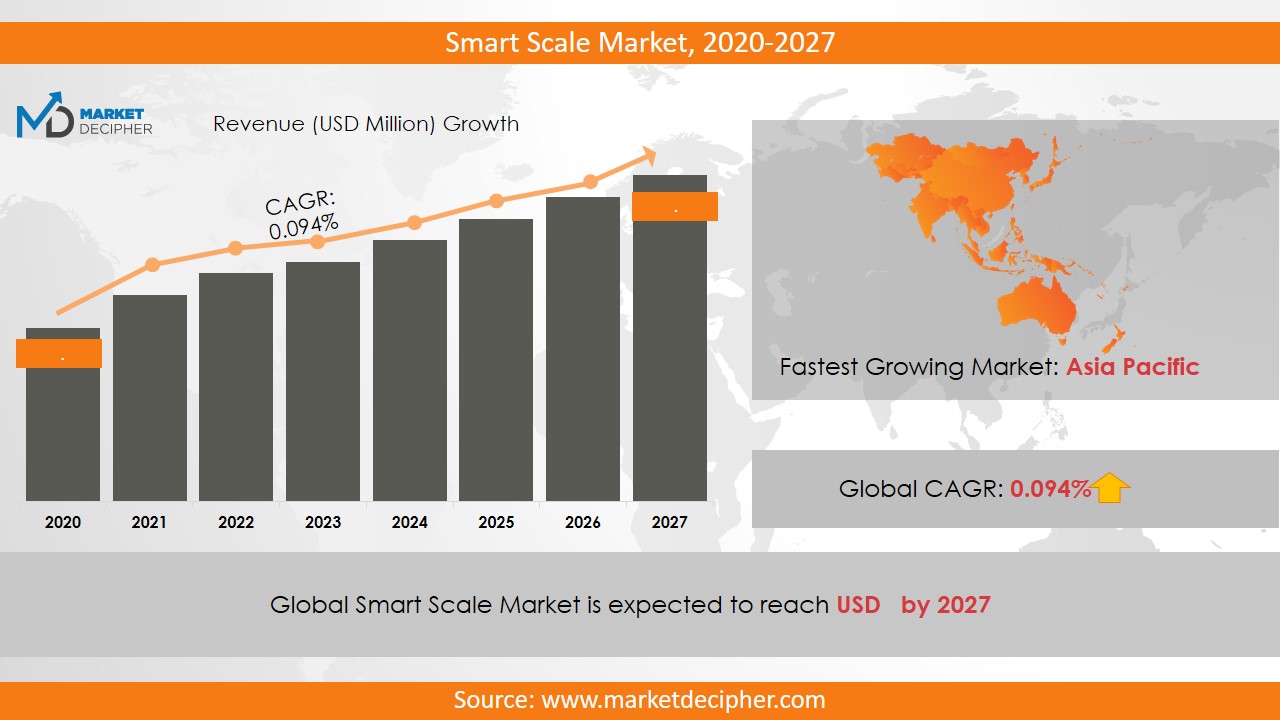
Smart Scale market revenue shall reach a value of $XX Million in 2026, growing with a CAGR of 12.8% during the forecast period of 2019 to 2026. In terms of volume sales, the market is anticipated to reach XX Units.
The smart scales are the technologically advanced measuring scales. These are used to measure bone mass, body mass index (BMI) and fat content. The major factors influencing the smart scale market trends are a change in lifestyle and health concerns of the consumers. Moreover, the rising health problems due to varying lifestyles such as diabetes, hypertension and cardiovascular diseases are responsible for the weight gain problems across the world. Due to the increasing weight of the consumers, there is a high increase in diseases nowadays, and various people are adopting weight management solutions. Thus, the rising adoption of such strategies among consumers is anticipated to fuel up the smart scale market sales over time.
Owing to the increasing adoption of automation technologies in many industries, the lifestyle of consumers has changed a lot. There is more technical work available in the industries rather than physical work, this results in the increasing weight gain problems among consumers. Thus, the rising trend of automation is contributing considerably to the smart scale market growth. Moreover, the stringent rules and regulations of the government regarding healthcare services is going to accelerate the market growth in the coming years.
REGIONAL ANALYSIS
The Asia Pacific dominated the industry in terms of revenue in 2018. The presence of a large number of smart scale manufacturers in this region is driving the revenue in the region. Moreover, the increasing awareness among consumers about healthy lefty style is one of the major drivers of the smart scale market shares. Further, this region is anticipated to fuel up the market revenue significantly over the forecast period owing to the increasing contribution of the developing countries like India, Japan, and China in augmenting the revenue of the market. Moreover, the North American region is also anticipated to grow significantly over the forecast period owing to the heavy competition among the industry players in these regions.
SEGMENT ANALYSIS
Based on type, the smart scale market research report provides a detailed analysis of glass and steel. Based on the application, the market has been bifurcated as object weighing and body mass weighing. The body mass weighing has shown its dominance in terms of revenue generated in recent years. The high growth of this segment is attributed to the changing and busy lifestyle of the consumers. Out of which, the body mass weighing segment has dominated the market revenue in 2018 and is anticipated to continue the same trend over the forecast period.
INDUSTRY PLAYERS ANALYSIS
Major industry players have been analyzed with coverage on their operating areas, revenues, and other strategic aspects. These industry players include Withings, A&D, GoWISE USA, Pyle, Taylor, MI, PICOOC, WiT, Newlineny, Yeshem, Runtastic, Omron, and iHealth. Further, the rising investment by various industry players is expected to augment the revenue significantly over the forecast period. Various industry players are adopting advanced strategies to increase the smart scale business acquisition across the world. Other industries in this domain that are growing at a high CAGR include Tubular Linear Motor Market and Precipitated Barium Sulphate Market.
COVERAGE HIGHLIGHTS
• Revenue Estimation and Forecast (2018 – 2026)
• Production Estimation and Forecast (2018 – 2026)
• Sales/Consumption Volume Estimation and Forecast (2018 – 2026)
• Breakdown of Revenue by Segments (2018 – 2026)
• Breakdown of Production by Segments (2018 – 2026)
• Breakdown of Sales Volume by Segments (2018 – 2026)
• Gross Margin and Profitability Analysis of Companies
• Business Trend and Expansion Analysis
• Import and Export Analysis
• Regional Analysis and Data Breakdown
SEGMENTAL ANALYSIS:
By Type Outlook ($Revenue and Unit Sales, 2018-2026)
· Glass
· Steel
By Application Outlook ($Revenue and Unit Sales, 2018-2026)
• Object weighing
• Body Mass weighing
By Regional Outlook ($Revenue and Unit Sales, 2018-2026)
• North America
• Canada
• U.S
• Mexico
• Europe
• Germany
• U.K
• France
• Netherlands
• Austria
• Rest of Europe
• Asia-Pacific
• China
• India
• Japan
• South Korea
• Australia
• Rest of Asia Pacific
• The Middle East and Africa
• Saudi Arabia
• United Arab Emirates
• Rest of Middle East
• Africa
• South America
• Brazil
• Argentina
• Rest of South America
INDUSTRY PLAYERS ANALYSIS:
• Withings
• A&D
• GoWISE USA,
• Pyle
• Taylor
• MI
• PICOOC
• WiT
• Newlineny
• Yeshem
• Runtastic
• Omron
• iHealth
• Garmin
• Qardio
CHAPTER 1. INTRODUCTION
1.1. RESEARCH METHODOLOGY
1.1.1. Data Collection
1.1.2. Data Modeling
1.1.3. Historical Revenue and Sales Estimation
1.1.4. Data Triangulation
1.2. RESEARCH PROCESS
1.2.1. Primary Research
1.2.2. Secondary Research
1.2.3. Survey Data
1.2.4. Validation by In-House Expert
1.3. SMART SCALE MARKET OVERVIEW
1.3.1. Research Scope and Market Definition
1.3.2. Executive Summary
CHAPTER 2. GLOBAL SMART SCALE MARKET DEMAND SIDE ANALYSIS
2.1. SMART SCALE MARKET CONSUMPTION VOLUME (MILLION UNITS), 2018 – 2025
2.2. MARKET CONSUMPTION VOLUME SPLIT BY REGION (MILLION UNITS), 2018 – 2025
2.3. MARKET CONSUMPTION VOLUME SPLIT BY COUNTRIES (MILLION UNITS), 2018 – 2025
2.4. MARKET REVENUE (MILLION USD), 2018-2025
2.5. MARKET REVENUE SPLIT BY REGION (MILLION UNITS), 2018 – 2025
2.6. SMART SCALE MARKET REVENUE SPLIT BY COUNTRIES (MILLION UNITS), 2018 – 2025
CHAPTER 3. GLOBAL SMART SCALE MARKET SUPPLY SIDE ANALYSIS
3.1. SMART SCALE MARKET PRODUCTION VOLUME (MILLION UNITS), 2018 – 2025
3.2. MARKET PRODUCTION VOLUME SPLIT BY REGION (MILLION UNITS), 2018-2025
3.3. MARKET PRODUCTION VOLUME SPLIT/RANKING BY COUNTRIES (MILLION UNITS), 2018 – 2025
CHAPTER 4. GLOBAL SMART SCALE MARKET COMPETITIVE SCENARIO & BUSINESS OPPORTUNITY ANALYSIS
4.1. COMPETITIVE STRENGTH RANKING BY MAJOR COUNTRIES, 2018
4.2. MARKET ATTRACTIVENESS RANKING BY MAJOR COUNTRIES, 2018 - 2025
4.3. EMERGING BUSINESS OPPORTUNITIES AND GROWTH PROSPECTS
4.3.1. Growth Drivers
4.3.2. Market Restraints
4.3.2. Opportunities
CHAPTER 5. GLOBAL SMART SCALE MARKET ENTRY STRATEGIES
5.1. ENTRY STRATEGIES IN DEVELOPING MARKETS
5.2. ENTRY STRATEGIES IN DEVELOPED MARKETS
CHAPTER 6. GLOBAL SMART SCALE MARKET BY TYPE
6.1. SEGMENT OUTLINE
6.2. REVENUE SHARE BY TYPE, $MILLION, 2018 – 2025
6.2. CONSUMPTION SHARE BY TYPE, MILLION UNITS, 2018 - 2025
6.3. PRODUCTION SHARE BY TYPE, MILLION UNITS, 2018 – 2025
6.4. GLASS
6.4.1. Market determinants and trend analysis
6.4.2. Market revenue, sales and production volume, 2018 – 2025
6.5. STEEL
6.5.1. Market determinants and trend analysis
6.5.2. Market revenue, sales and production volume, 2018 – 2025
CHAPTER 7. GLOBAL SMART SCALE MARKET BY APPLICATION
7.1. SEGMENT OUTLINE
7.2. REVENUE SHARE BY APPLICATION, $MILLION, 2018 – 2025
7.2. CONSUMPTION SHARE BY APPLICATION, MILLION UNITS, 2018 - 2025
7.3. PRODUCTION SHARE BY APPLICATION, MILLION UNITS, 2018 – 2025
7.4. OBJECT WEIGHING
7.4.1. Market determinants and trend analysis
7.4.2. Market revenue, sales and production volume, 2018 – 2025
7.5. BODY MASS WEIGHING
7.5.1. Market determinants and trend analysis
7.5.2. Market revenue, sales and production volume, 2018 – 2025
CHAPTER 8. GLOBAL SMART SCALE MARKET BY REGIONS
8.1. REGIONAL OUTLOOK
8.2. MARKET PRODUCTION, CONSUMPTION & REVENUE BY REGION, 2018-2025
8.3. NORTH AMERICA
8.3.1. Current Trends and Future Prospects
8.3.2. North America market revenue, sales and production volume, 2018 – 2025
8.3.3. The U.S.
8.3.3.1. Smart Scale Market Revenue $Million (2018 – 2025)
8.3.3.2. Smart Scale Market Consumption Million Units (2018 – 2025)
8.3.3.3. Smart Scale Market Production Million Units (2018 – 2025)
8.3.4. Canada
8.3.4.1. Smart Scale Market Revenue $Million (2018 – 2025)
8.3.4.2. Smart Scale Market Consumption Million Units (2018 – 2025)
8.3.4.3. Smart Scale Market Production Million Units (2018 – 2025)
8.3.5. Mexico
8.3.5.1. Smart Scale Market Revenue $Million (2018 – 2025)
8.3.5.2. Smart Scale Market Consumption Million Units (2018 – 2025)
8.3.5.3. Smart Scale Market Production Million Units (2018 – 2025)
8.4. EUROPE
8.4.1. Current Trends and Future Prospects
8.4.2. Europe market revenue, sales and production volume, 2018 – 2025
8.4.3. U.K
8.4.3.1. Smart Scale Market Revenue $Million (2018 – 2025)
8.4.3.2. Smart Scale Market Consumption Million Units (2018 – 2025)
8.4.3.3. Smart Scale Market Production Million Units (2018 – 2025)
8.4.4. Germany
8.4.4.1. Smart Scale Market Revenue $Million (2018 – 2025)
8.4.4.2. Smart Scale Market Consumption Million Units (2018 – 2025)
8.4.4.3. Smart Scale Market Production Million Units (2018 – 2025)
8.4.5. France
8.4.5.1. Smart Scale Market Revenue $Million (2018 – 2025)
8.4.5.2. Smart Scale Market Consumption Million Units (2018 – 2025)
8.4.5.3. Smart Scale Market Production Million Units (2018 – 2025)
8.4.6. Italy
8.4.6.1. Smart Scale Market Revenue $Million (2018 – 2025)
8.4.6.2. Smart Scale Market Consumption Million Units (2018 – 2025)
8.4.6.3. Smart Scale Market Production Million Units (2018 – 2025)
8.4.7. Rest of Europe
8.4.7.1. Smart Scale Market Revenue $Million (2018 – 2025)
8.4.7.2. Smart Scale Market Consumption Million Units (2018 – 2025)
8.4.7.3. Smart Scale Market Production Million Units (2018 – 2025)
8.5. ASIA PACIFIC
8.5.1. Current Trends and Future Prospects
8.5.2. Europe market revenue, sales and production volume, 2018 – 2025
8.5.3. India
8.5.3.1. Smart Scale Market Revenue $Million (2018 – 2025)
8.5.3.2. Smart Scale Market Consumption Million Units (2018 – 2025)
8.5.3.3. Smart Scale Market Production Million Units (2018 – 2025)
8.5.4. Japan
8.5.4.1. Smart Scale Market Revenue $Million (2018 – 2025)
8.5.4.2. Smart Scale Market Consumption Million Units (2018 – 2025)
8.5.4.3. Smart Scale Market Production Million Units (2018 – 2025)
8.5.5. China
8.5.5.1. Smart Scale Market Revenue $Million (2018 – 2025)
8.5.5.2. Smart Scale Market Consumption Million Units (2018 – 2025)
8.5.5.3. Smart Scale Market Production Million Units (2018 – 2025)
8.5.6. South Korea
8.5.6.1. Smart Scale Market Revenue $Million (2018 – 2025)
8.5.6.2. Smart Scale Market Consumption Million Units (2018 – 2025)
8.5.6.3. Smart Scale Market Production Million Units (2018 – 2025)
8.5.7. Rest of APAC
8.5.7.1. Smart Scale Market Revenue $Million (2018 – 2025)
8.5.7.2. Smart Scale Market Consumption Million Units (2018 – 2025)
8.5.7.3. Smart Scale Market Production Million Units (2018 – 2025)
8.6. REST OF THE WORLD
8.6.1. Current Trends and Future Prospects
8.6.2. Europe market revenue, sales and production volume, 2018 – 2025
8.6.3. Latin America
8.6.3.1. Smart Scale Market Revenue $Million (2018 – 2025)
8.6.3.2. Smart Scale Market Consumption Million Units (2018 – 2025)
8.6.3.3. Smart Scale Market Production Million Units (2018 – 2025)
8.6.4. Middle East
8.6.4.1. Smart Scale Market Revenue $Million (2018 – 2025)
8.6.4.2. Smart Scale Market Consumption Million Units (2018 – 2025)
8.6.4.3. Smart Scale Market Production Million Units (2018 – 2025)
8.6.5. Africa
8.6.5.1. Smart Scale Market Revenue $Million (2018 – 2025)
8.6.5.2. Smart Scale Market Consumption Million Units (2018 – 2025)
8.6.5.3. Smart Scale Market Production Million Units (2018 – 2025)
CHAPTER 9. KEY VENDOR PROFILES
9.1. Withings
9.1.1. Company overview
9.1.2. Portfolio Analysis
9.1.3. Estimated revenue from smart scale business and market share
9.1.4. Regional & business segment Revenue Analysis
9.2. A&D
9.2.1. Company overview
9.2.2. Portfolio Analysis
9.2.3. Estimated revenue from smart scale business and market share
9.2.4. Regional & business segment Revenue Analysis
9.3. GoWISE USA
9.3.1. Company overview
9.3.2. Portfolio Analysis
9.3.3. Estimated revenue from smart scale business and market share
9.3.4. Regional & business segment Revenue Analysis
9.4. Pyle
9.4.1. Company overview
9.4.2. Portfolio Analysis
9.4.3. Estimated revenue from smart scale business and market share
9.4.4. Regional & business segment Revenue Analysis
9.5. Taylor
9.5.1. Company overview
9.5.2. Portfolio Analysis
9.5.3. Estimated revenue from smart scale business and market share
9.5.4. Regional & business segment Revenue Analysis
9.6. MI
9.6.1. Company overview
9.6.2. Portfolio Analysis
9.6.3. Estimated revenue from smart scale business and market share
9.6.4. Regional & business segment Revenue Analysis
9.7. , PICOOC
9.7.1. Company overview
9.7.2. Portfolio Analysis
9.7.3. Estimated revenue from smart scale business and market share
9.7.4. Regional & business segment Revenue Analysis
9.8. WiT
9.8.1. Company overview
9.8.2. Portfolio Analysis
9.8.3. Estimated revenue from smart scale business and market share
9.8.4. Regional & business segment Revenue Analysis
9.9. Newlineny
9.9.1. Company overview
9.9.2. Portfolio Analysis
9.9.3. Estimated revenue from smart scale business and market share
9.9.4. Regional & business segment Revenue Analysis
9.10. Yeshem
9.10.1. Company overview
9.10.2. Portfolio Analysis
9.10.3. Estimated revenue from smart scale business and market share
9.10.4. Regional & business segment Revenue Analysis
9.11. Runtastic
9.11.1. Company overview
9.11.2. Portfolio Analysis
9.11.3. Estimated revenue from smart scale business and market share
9.11.4. Regional & business segment Revenue Analysis
9.12. Omron
9.12.1. Company overview
9.12.2. Portfolio Analysis
9.12.3. Estimated revenue from smart scale business and market share
9.12.4. Regional & business segment Revenue Analysis
9.13. iHealth
9.13.1. Company overview
9.13.2. Portfolio Analysis
9.13.3. Estimated revenue from smart scale business and market share
9.13.4. Regional & business segment Revenue Analysis
9.14. Garmin
9.14.1. Company overview
9.14.2. Portfolio Analysis
9.14.3. Estimated revenue from smart scale business and market share
9.14.4. Regional & business segment Revenue Analysis
9.15. Qardio
9.15.1. Company overview
9.15.2. Portfolio Analysis
9.15.3. Estimated revenue from smart scale business and market share
9.15.4. Regional & business segment Revenue Analysis
PURCHASE OPTIONS
20% Free Customization ON ALL PURCHASE
*Terms & Conditions Apply
Looking for report on this market in a particular region or country? Get In Touch
Request Free Sample
Please fill in the form below to Request for free Sample Report
-
Office Hours Mon - Sat 10:00 - 16:00
-
Call Us +91 6201075429
-
Send Us Mail sales@marketdecipher.com
Market Decipher is a market research and consultancy firm involved in provision of market reports to organisations of varied sizes; small, large and medium.

© 2018 Market Decipher. All Rights Reserved