Solid State Lighting Display Market Revenue, Sales Volume & Trend Forecast Report, 2019-2026
By Application (Medical lighting, Automotive Lighting, Backlighting, General Lighting and Others), By Technology (OLED, LED and others), By End-Use (Transport and Automotive, Conventional lighting, Media, Healthcare, Consumer Electronics, Entertainment, Educational, Industrial and Residential), By Installation (Retrofit and New Installation), By Region (North America, Europe, APAC and Rest of the World)
- Report ID : MD1025 |
- Pages : 192 |
- Tables : 88 |
- Formats :


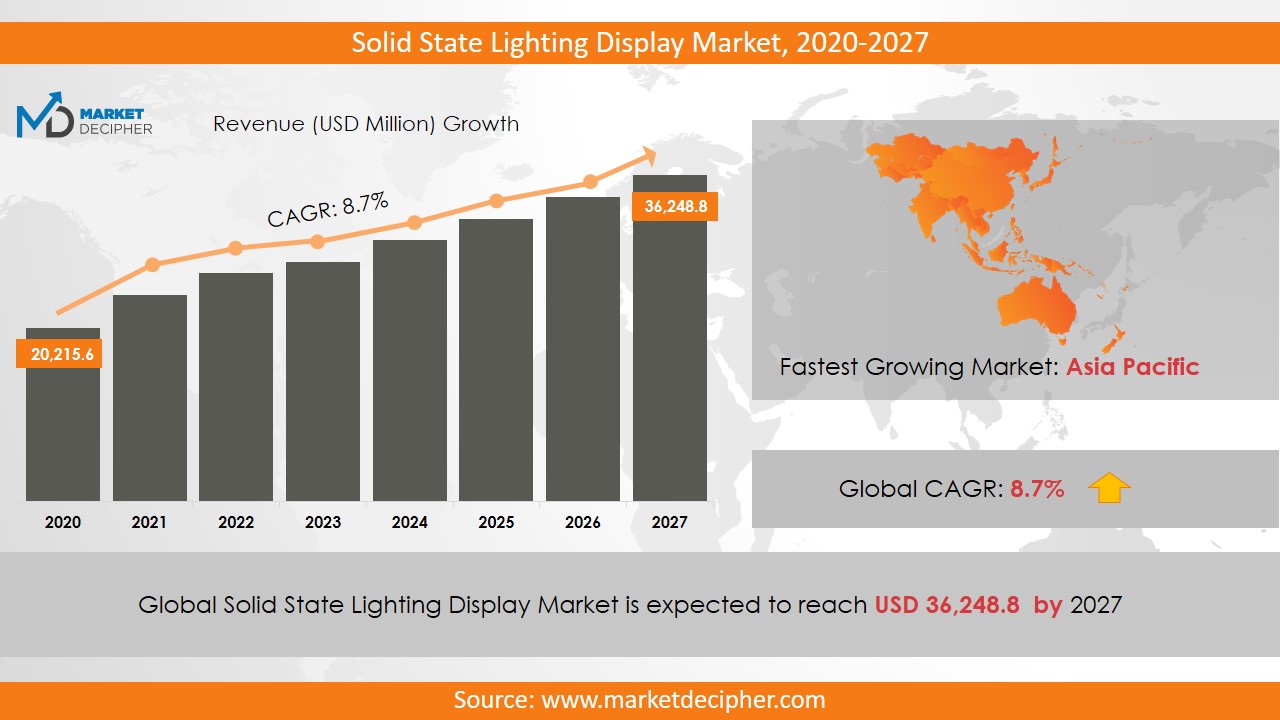
Solid state lighting display market revenue shall reach a value of $XX Million in 2026, growing with a CAGR of XX.X% during the forecast period of 2018 to 2026. In terms of volume sales, the market is anticipated to reach XX Units.
The increasing demand of consumers for highly advanced lighting technologies will develop the market in the coming years. The integration of this technology with the Internet of things increases the solid-state lighting display markets growth largely. The solid-state lighting display is a better replacement for traditional lighting display. They use visible lights, which helps in reducing power loss and reduces heat dissipation. These displays are highly efficient and have a long life as compared to traditional light sources. Technological advancements have increased its application in many new areas such as traffic light, exit signals, etc. However, the high cost of these displays is a big challenge for the growth of Solid-state lighting display market sales. Also, this display is widely used in the transport and automotive sectors.
In recent years, the introduction of LED (light-emitting diode) has completely changed market behavior. Long life, stability, and energy-saving factors are the advanced facilities provided by these lighting systems due to which this market is getting more strength. Also, they provide superior quality light, small and flexible light fixtures, which are in conjunction with proof design, which is expected to drive the solid-state lightning display market shares. The solid-state lighting system is environment-friendly because there is no hazardous substance or ultraviolet radiation. The solid-state lighting system application device can work at a lower temperature than CFL, which claims to increase the Solid-state lighting display market size.
REGIONAL ANALYSIS
North America has emerged as the dominant region in generating revenue in recent years. The Asia Pacific region has registered to account for more than 30% of the overall revenue in 2018. The other region regions such as Europe and Latin America have also contributed to the growth of the market. Since the use of incandescent bulbs in developed countries is prohibited, and in parts of Asia-Pacific and in Europe, these regions use solid state lighting displays widely.
SEGMENT ANALYSIS
In terms of application, the solid-state lighting display market provides a detailed analysis of Medical lighting, automotive lighting, Backlighting, General Lighting, and Others. The general lighting segment is expected to show its dominance in terms of its revenue and the automotive lighting segment is expected to garner a notable revenue during the forecast period. Based on technology, the bifurcation has been done as OLED, LED, and Others. Based on end-use, the market has been segmented as Transport and Automotive, Conventional lighting, Media, Healthcare, Consumer Electronics, Entertainment, Educational, Industrial, and Residential. Based on installation, the market has been segmented as retrofit and new installation.
INDUSTRY PLAYER ANALYSIS
Major industry players have been analyzed with coverage on their operating areas, revenues, and other strategic aspects. These industry players include Automotive Lighting LLC, Energy Focus Incorporated, Data Display Products Incorporated, Aixtron AG, Royal Philips Electronics, Nichia Group, GE Lighting, and Toshiba Lighting Products. Various industry players are adopting advanced technologies in order to acquire acquisitions all over the world. Other industries in this domain that is growing at a high CAGR include Multi Function Display (MFD) Market and Holographic Display Market.
COVERAGE HIGHLIGHTS
• Revenue Estimation and Forecast (2018 – 2026)
• Production Estimation and Forecast (2018 – 2026)
• Sales/Consumption Volume Estimation and Forecast (2018 – 2026)
• Breakdown of Revenue by Segments (2018 – 2026)
• Breakdown of Production by Segments (2018 – 2026)
• Breakdown of Sales Volume by Segments (2018 – 2026)
• Gross Margin and Profitability Analysis of Companies
• Business Trend and Expansion Analysis
• Import and Export Analysis
• Regional Analysis and Data Breakdown
SEGMENTAL ANALYSIS
By Application Outlook ($Revenue and Unit Sales, 2018-2026)
• Medical lighting
• Automotive lighting
• Backlighting
• General Lighting
• Others
By Technology Outlook ($Revenue and Unit Sales, 2018-2026)
• OLED
• LED
• Others
By End-Use Outlook ($Revenue and Unit Sales, 2018-2026)
• Transport and Automotive
• Conventional lighting
• Media
• Healthcare
• Consumer Electronics
• Entertainment
• Educational
• Industrial
• Residential
By Installation Outlook ($Revenue and Unit Sales, 2018-2026)
• Retrofit
• Ne Installation
By Geographical Outlook ($Revenue and Unit Sales, 2018-2026)
• North America
• Canada
• U.S
• Europe
• U.K
• Germany
• Asia-Pacific
• Japan
• China
• Rest of the World
• Latin America
• The Middle East and Africa
CHAPTER 1: INTRODUCTION
1.1. Research Methodology
1.1.1. Desk Research
1.1.2. Data Synthesis
1.1.3. Data Validation & Market Feedback
1.1.4. Data Sources
CHAPTER 2: EXECUTIVE SUMMARY
2.1. Global Market Outlook
2.2. Core Insights - Application
2.3. Core Insights – Technology
2.4. Core Insights – End-Use
2.5. Core Insights – Installation
2.6. Core Insights – Geography
CHAPTER 3: MARKET OVERVIEW
3.1. Market Definition and Scope
3.2. Key Forces Shaping the Industry
3.2.1. Bargaining Power of Suppliers
3.2.2. Bargaining Power of Buyers
3.2.3. Threat of Substitutes
3.2.4. Threat of New Entrants
3.3. Market Dynamics
3.3.1. Drivers
3.3.1.1. Supply-side Drivers
3.3.1.2. Demand-side Drivers
3.3.2. Restraints
3.3.3. Opportunities
3.4. Industry Landscape - PESTEL Analysis
3.4.1. Political Landscape
3.4.2. Environmental Landscape
3.4.3. Social Landscape
3.4.4. Technology Landscape
3.4.5. Economic Landscape
CHAPTER 4: MARKET BACKGROUND
4.1. Industry Value Chain Analysis
4.1.1. Upstream Participants
4.1.2. Downstream participants
4.2. Pricing Analysis and Forecast, 2018-2026
4.2.1. By Type
4.2.2. By Region
CHAPTER 5: GLOBAL SOLID STATE LIGHTENING DISPLAY MARKET, BY APPLICATION
5.1. Overview
5.1.1. Market Volume and Forecast, 2018-2026
5.1.2. Market Revenue (US$ Million) and Forecast, 2018-2026
5.2. Medical lighting
5.2.1. Key Market Trends, Growth Factors and Opportunities
5.2.2. Market Volume and Forecast, By Region
5.2.3. Market Revenue (US$ Million) and Forecast, By Region
5.3. Automotive lighting
5.3.1. Key Market Trends, Growth Factors and Opportunities
5.3.2. Market Volume and Forecast, By Region
5.3.3. Market Revenue (US$ Million) and Forecast, By Region
5.4. Backlighting
5.4.1. Key Market Trends, Growth Factors and Opportunities
5.4.2. Market Volume and Forecast, By Region
5.4.3. Market Revenue (US$ Million) and Forecast, By Region
5.5. General Lighting
5.5.1. Key Market Trends, Growth Factors and Opportunities
5.5.2. Market Volume and Forecast, By Region
5.5.3. Market Revenue (US$ Million) and Forecast, By Region
5.6. Others
5.6.1. Key Market Trends, Growth Factors and Opportunities
5.6.2. Market Volume and Forecast, By Region
5.6.3. Market Revenue (US$ Million) and Forecast, By Region
CHAPTER 6: GLOBAL SOLID STATE LIGHTENING DISPLAY MARKET, BY TECHNOLOGY
6.1. Overview
6.1.1. Market Volume and Forecast, 2018-2026
6.1.2. Market Revenue (US$ Million) and Forecast, 2018-2026
6.2. OLED
6.2.1. Key Market Trends, Growth Factors and Opportunities
6.2.2. Market Volume and Forecast, By Region
6.2.3. Market Revenue (US$ Million) and Forecast, By Region
6.3. LED
6.3.1. Key Market Trends, Growth Factors and Opportunities
6.3.2. Market Volume and Forecast, By Region
6.3.3. Market Revenue (US$ Million) and Forecast, By Region
6.4. Others
6.4.1. Key Market Trends, Growth Factors and Opportunities
6.4.2. Market Volume and Forecast, By Region
6.4.3. Market Revenue (US$ Million) and Forecast, By Region
CHAPTER 7: GLOBAL SOLID STATE LIGHTENING DISPLAY MARKET, BY END-USE
7.1. Overview
7.1.1. Market Volume and Forecast, 2018-2026
7.1.2. Market Revenue (US$ Million) and Forecast, 2018-2026
7.2. Transport
7.2.1. Key Market Trends, Growth Factors and Opportunities
7.2.2. Market Volume and Forecast, By Region
7.2.3. Market Revenue (US$ Million) and Forecast, By Region
7.3. Conventional lighting
7.3.1. Key Market Trends, Growth Factors and Opportunities
7.3.2. Market Volume and Forecast, By Region
7.3.3. Market Revenue (US$ Million) and Forecast, By Region
7.4. Media
7.4.1. Key Market Trends, Growth Factors and Opportunities
7.4.2. Market Volume and Forecast, By Region
7.4.3. Market Revenue (US$ Million) and Forecast, By Region
7.5. Healthcare
7.5.1. Key Market Trends, Growth Factors and Opportunities
7.5.2. Market Volume and Forecast, By Region
7.5.3. Market Revenue (US$ Million) and Forecast, By Region
7.6. Consumer Electronics
7.6.1. Key Market Trends, Growth Factors and Opportunities
7.6.2. Market Volume and Forecast, By Region
7.6.3. Market Revenue (US$ Million) and Forecast, By Region
7.7. Entertainment
7.7.1. Key Market Trends, Growth Factors and Opportunities
7.7.2. Market Volume and Forecast, By Region
7.7.3. Market Revenue (US$ Million) and Forecast, By Region
7.8. Educational
7.8.1. Key Market Trends, Growth Factors and Opportunities
7.8.2. Market Volume and Forecast, By Region
7.8.3. Market Revenue (US$ Million) and Forecast, By Region
7.9. Industrial
7.9.1. Key Market Trends, Growth Factors and Opportunities
7.9.2. Market Volume and Forecast, By Region
7.9.3. Market Revenue (US$ Million) and Forecast, By Region
7.10. Residential
7.10.1. Key Market Trends, Growth Factors and Opportunities
7.10.2. Market Volume and Forecast, By Region
7.10.3. Market Revenue (US$ Million) and Forecast, By Region
CHAPTER 8: GLOBAL SOLID STATE LIGHTENING DISPLAY MARKET, BY INSTALLATION
8.1. Overview
8.1.1. Market Volume and Forecast, 2018-2026
8.1.2. Market Revenue (US$ Million) and Forecast, 2018-2026
8.2. Retrofit
8.2.1. Key Market Trends, Growth Factors and Opportunities
8.2.2. Market Volume and Forecast, By Region
8.2.3. Market Revenue (US$ Million) and Forecast, By Region
8.3. Ne Installation
8.3.1. Key Market Trends, Growth Factors and Opportunities
8.3.2. Market Volume and Forecast, By Region
8.3.3. Market Revenue (US$ Million) and Forecast, By Region
CHAPTER 9: GLOBAL SOLID STATE LIGHTENING DISPLAY MARKET, BY GEOGRAPHY
9.1. Overview
9.2. North America
9.2.1. Key Market Trends, Growth Factors and Opportunities
9.2.2. Market Volume and Forecast, By Application
9.2.3. Market Volume and Forecast, By Technology
9.2.4. Market Volume and Forecast, By End-Use
9.2.5. Market Volume and Forecast, By Installation
9.2.6. Market Revenue and Forecast, By Application
9.2.7. Market Revenue and Forecast, By Technology
9.2.8. Market Revenue and Forecast, By End-Use
9.2.9. Market Revenue and Forecast, By Installation
9.2.10. Market Revenue and Forecast, By Country
9.2.11. U.S.
9.2.11.1. Market Volume and Forecast
9.2.11.2. Market Revenue and Forecast
9.2.12. Canada
9.2.12.1. Market Volume and Forecast
9.2.12.2. Market Revenue and Forecast
9.2.13. Mexico
9.2.13.1. Market Volume and Forecast
9.2.13.2. Market Revenue and Forecast
9.3. Europe
9.3.1. Market Volume and Forecast, By Application
9.3.2. Market Volume and Forecast, By Technology
9.3.3. Market Volume and Forecast, By End-Use
9.3.4. Market Volume and Forecast, By Installation
9.3.5. Market Revenue and Forecast, By Application
9.3.6. Market Revenue and Forecast, By Technology
9.3.7. Market Revenue and Forecast, By End-Use
9.3.8. Market Revenue and Forecast, By Installation
9.3.9. Market Revenue and Forecast, By Country
9.3.10. Germany
9.3.10.1. Market Volume and Forecast, By Application
9.3.10.2. Market Revenue and Forecast, By Technology
9.3.11. UK
9.3.11.1. Market Volume and Forecast, By Application
9.3.11.2. Market Revenue and Forecast, By Technology
9.3.12. France
9.3.12.1. Market Volume and Forecast, By Application
9.3.12.2. Market Revenue and Forecast, By Technology
9.3.13. Italy
9.3.13.1. Market Volume and Forecast, By Application
9.3.13.2. Market Revenue and Forecast, By Technology
9.3.14. Rest of Europe
9.3.14.1. Market Volume and Forecast, By Application
9.3.14.2. Market Revenue and Forecast, By Technology
9.4. Asia-Pacific
9.4.1. Market Volume and Forecast, By Application
9.4.2. Market Volume and Forecast, By Technology
9.4.3. Market Volume and Forecast, By End-Use
9.4.4. Market Volume and Forecast, By Installation
9.4.5. Market Revenue and Forecast, By Application
9.4.6. Market Revenue and Forecast, By Technology
9.4.7. Market Revenue and Forecast, By End-Use
9.4.8. Market Revenue and Forecast, By Installation
9.4.9. Market Revenue and Forecast, By Country
9.4.10. China
9.4.10.1. Market Volume and Forecast, By Application
9.4.10.2. Market Revenue and Forecast, By Technology
9.4.11. India
9.4.11.1. Market Volume and Forecast, By Application
9.4.11.2. Market Revenue and Forecast, By Technology
9.4.12. Japan
9.4.12.1. Market Volume and Forecast, By Application
9.4.12.2. Market Revenue and Forecast, By Technology
9.4.13. South Korea
9.4.13.1. Market Volume and Forecast, By Application
9.4.13.2. Market Revenue and Forecast, By Technology
9.4.14. Rest of Asia-Pacific
9.4.14.1. Market Volume and Forecast, By Application
9.4.14.2. Market Revenue and Forecast, By Technology
9.5. REST OF THE WORLD
9.5.1. Market Volume and Forecast, By Application
9.5.2. Market Volume and Forecast, By Technology
9.5.3. Market Volume and Forecast, By End-Use
9.5.4. Market Volume and Forecast, By Installation
9.5.5. Market Revenue and Forecast, By Application
9.5.6. Market Revenue and Forecast, By Technology
9.5.7. Market Revenue and Forecast, By End-Use
9.5.8. Market Revenue and Forecast, By Installation
9.5.9. Market Revenue and Forecast, By Country
9.5.10. Latin America
9.5.10.1. Market Volume and Forecast, By Application
9.5.10.2. Market Revenue and Forecast, By Technology
9.5.11. Middle East
9.5.11.1. Market Volume and Forecast, By Application
9.5.11.2. Market Revenue and Forecast, By Technology
9.5.12. Africa
9.5.12.1. Market Volume and Forecast, By Application
9.5.12.2. Market Revenue and Forecast, By Technology
CHAPTER 10: COMPETITIVE LANDSCAPE
10.1. Solid State Lightening Display Market Share Analysis, 2018
PURCHASE OPTIONS
20% Free Customization ON ALL PURCHASE
*Terms & Conditions Apply
Looking for report on this market in a particular region or country? Get In Touch
Request Free Sample
Please fill in the form below to Request for free Sample Report
-
Office Hours Mon - Sat 10:00 - 16:00
-
Call Us +91 6201075429
-
Send Us Mail sales@marketdecipher.com
Market Decipher is a market research and consultancy firm involved in provision of market reports to organisations of varied sizes; small, large and medium.

© 2018 Market Decipher. All Rights Reserved