Level Sensor Market
By Sensor Type (Ultrasonic, Pneumatic and Vibrating point), By Technology (Contact type and Non-contact type), By Application (Continuous, Point and Interface level), By Industry Vertical (Food and Beverage Processing, Chemical, Oil and gas, Water and wastewater treatment and Pharmaceutical), By Region (North America, Europe, APAC and Rest of the World)
- Report ID : MD1048 |
- Pages : 91 |
- Tables : 83 |
- Formats :


Level sensors find their wide application in detecting fluid and fluid levels in different industries. The increasing use of the level sensor devices in various fields such as oil and gas, food and beverage process, water and wastewater treatments, pharmaceutical and chemical industries is responsible for augmenting level sensors market share significantly over time. The rising trend of automation among various industries is leading to increased production. The low cost of installation and maintenance of level sensors is expected to increase level sensors market sales in the coming years.
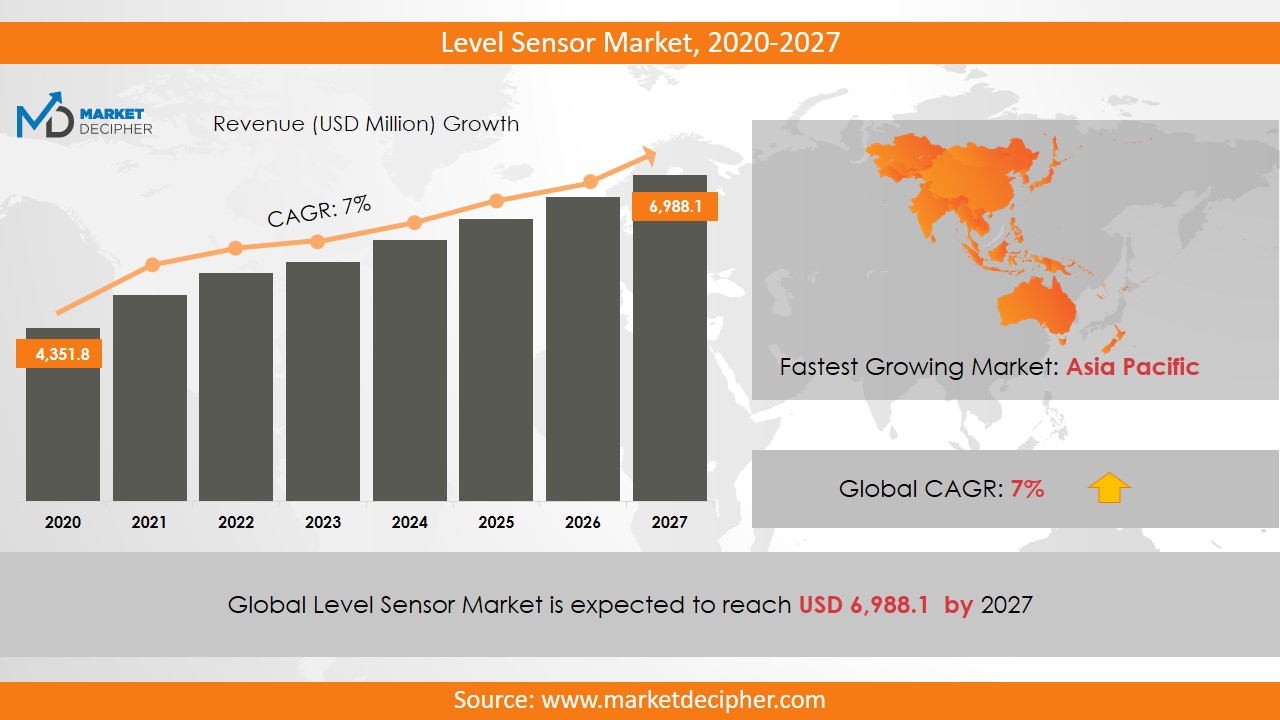
The market revenue of Level Sensor shall reach a value of $5.98 Billion in 2031, growing with a CAGR of 5.7% during the forecast period of 2022 to 2031. In terms of volume sales, the market is anticipated to reach XX Units.
Further, the ultrasonic sensors provide flexibility in the installation option which supports the market growth substantially.
Moreover, the strict rules and regulations have been imposed by the government on various industries to adopt these sensors for achieving security and safety goals. The advantages provided by these sensors are high efficiency, improved performance and high accuracy. Nowadays, different industries are adopting water treatment systems for the conservation of water which is going to augment the market revenue substantially. The prominent level sensors market trends include remote calibration and configuration which is leading the level sensors industry to garner commendable revenue during the forecast period. Honeywell Process Solutions (HPS) introduced a new solution to increase efficiency in midstream gas metering system monitoring operations. This solution is extensively used in the oil and gas industry.
REGIONAL ANALYSIS:
The Asia Pacific region has contributed substantially in 2022 owing to the increased adoption of the automation technology among industries in the region. Further, the region is anticipated to continue the same trend over the forecast period. The other developing nations such as India and China are also supporting the growth market revenue significantly. North America has witnessed a commendable growth in its market over the last few years. Due to well developed automated facilities in this region, it is further expected to grow at a fast rate throughout the forecast period.
SEGMENT ANALYSIS:
In terms of sensor type, the market has been segmented as an ultrasonic, pneumatic and vibrating point. In terms of technology, the segmentation has been done as a contact type and non-contact type. Based on the application, the market has been bifurcated as continuous, point and interface level. Some key factors responsible for developing this section are increasing public awareness about water conservation and strict government regulations to implement the treatment processes.
In terms of industry vertical, the level sensors market report provides an in-depth analysis of Food and Beverage Processing, chemical, oil and gas, water and wastewater treatment and pharmaceutical. Out of these, the wastewater treatment section gained the maximum traction in 2022 and is expected to maintain the same trend in the coming future. Also, these sensors do not require high maintenance to work properly and thus they have a long life.
INDUSTRY PLAYER ANALYSIS:
Major industry players have been analyzed with coverage on their operating areas, revenues, and other strategic aspects. These industry players include SICK AG, Emerson Electric company, AMETEK Incorporated, Texas Instruments Incorporated, TE Connectivity Limited, Pepperl+Fuchs GmbH, Nohken Incorporated, Endress+Hauser AG, First Sensor AG, Forgive Corporation, Krohne Messtechnik GmbH, ABB Limite, and Siemens AG. Other industries in this domain that are growing at a high CAGR include Photoelectric Sensors Market and Image Sensor Market.
COVERAGE HIGHLIGHTS
• Revenue Estimation and Forecast (2022 – 2031)
• Production Estimation and Forecast (2022 – 2031)
• Sales/Consumption Volume Estimation and Forecast (2022 – 2031)
• Breakdown of Revenue by Segments (2022 – 2031)
• Breakdown of Production by Segments (2022 – 2031)
• Breakdown of Sales Volume by Segments (2022 – 2031)
• Gross Margin and Profitability Analysis of Companies
• Business Trend and Expansion Analysis
• Import and Export Analysis
• Regional Analysis and Data Breakdown
SEGMENTAL ANALYSIS:
By Sensor Type Outlook ($Revenue and Unit Sales, 2022-2031)
• Ultrasonic
• Pneumatic
• Vibrating Point
By Technology Outlook ($Revenue and Unit Sales, 2022-2031)
• Non-Contact Type
• Contact type
By Application Outlook ($Revenue and Unit Sales, 2022-2031)
• Continuous level
• Point level
• Interface level
By Industry Vertical Outlook ($Revenue and Unit Sales, 2022-2031)
• Food and Beverage Processing
• Chemical
• Oil and gas
• Water and Waste Water treatment
• Pharmaceutical
By Regional Outlook ($Revenue and Unit Sales, 2022-2031)
• North America
• Canada
• U.S
• Mexico
• Europe
• Germany
• France
• U.K
• Rest of Europe
• Asia-Pacific
• China
• India
• Japan
• Rest of Asia Pacific
• Rest of the World
• Middle East
• Africa
• Latin America
INDUSTRY PLAYER ANALYSIS:
• SICK AG
• Emerson Electric company
• AMETEK Incorporated
• Texas Instruments Incorporated
• TE Connectivity Limited
• Pepperl+Fuchs GmbH
• Nohken Incorporated
• Endress+Hauser AG
• First Sensor AG
• Fortive Corporation
• Krohne Messtechnik GmbH
• ABB Limited
• Siemens AGL
Need Report on a particular Country OR need a Tailored/Customized Research? Budget Limits/Price Discounts Query...!
Email to David Correa
OR Fill the below "Sample Request FORM" with your queries in the message box.
CHAPTER 1. INTRODUCTION
1.1. RESEARCH METHODOLOGY
1.1.1. Data Collection
1.1.2. Data Modeling
1.1.3. Historical Revenue and Sales Estimation
1.1.4. Data Triangulation
1.2. RESEARCH PROCESS
1.2.1. Primary Research
1.2.2. Secondary Research
1.2.3. Survey Data
1.2.4. Validation by In-House Expert
1.3. LEVEL SENSOR MARKET OVERVIEW
1.3.1. Research Scope and Market Definition
1.3.2. Executive Summary
CHAPTER 2. GLOBAL LEVEL SENSOR MARKET DEMAND SIDE ANALYSIS
2.1. LEVEL SENSOR MARKET CONSUMPTION VOLUME (BILLION UNITS), 2018 – 2025
2.2. MARKET CONSUMPTION VOLUME SPLIT BY REGION (BILLION UNITS), 2018 – 2025
2.3. MARKET CONSUMPTION VOLUME SPLIT BY COUNTRIES (BILLION UNITS), 2018 – 2025
2.4. MARKET REVENUE (BILLION USD), 2018-2025
2.5. MARKET REVENUE SPLIT BY REGION (BILLION UNITS), 2018 – 2025
2.6. LEVEL SENSOR MARKET REVENUE SPLIT BY COUNTRIES (BILLION UNITS), 2018 – 2025
CHAPTER 3. GLOBAL LEVEL SENSOR MARKET SUPPLY SIDE ANALYSIS
3.1. LEVEL SENSOR MARKET PRODUCTION VOLUME (BILLION UNITS), 2018 – 2025
3.2. MARKET PRODUCTION VOLUME SPLIT BY REGION (BILLION UNITS), 2018-2025
3.3. MARKET PRODUCTION VOLUME SPLIT/RANKING BY COUNTRIES (BILLION UNITS), 2018 – 2025
CHAPTER 4. GLOBAL LEVEL SENSOR MARKET COMPETITIVE SCENARIO & BUSINESS OPPORTUNITY ANALYSIS
4.1. COMPETITIVE STRENGTH RANKING BY MAJOR COUNTRIES, 2018
4.2. MARKET ATTRACTIVENESS RANKING BY MAJOR COUNTRIES, 2018 - 2025
4.3. EMERGING BUSINESS OPPORTUNITIES AND GROWTH PROSPECTS
4.3.1. Growth Drivers
4.3.2. Market Restraints
4.3.2. Opportunities
CHAPTER 5. GLOBAL LEVEL SENSOR MARKET ENTRY STRATEGIES
5.1. ENTRY STRATEGIES IN DEVELOPING MARKETS
5.2. ENTRY STRATEGIES IN DEVELOPED MARKETS
CHAPTER 6. GLOBAL LEVEL SENSOR MARKET BY SENSOR TYPE
6.1. SEGMENT OUTLINE
6.2. REVENUE SHARE BY SENSOR TYPE, $BILLION, 2018 – 2025
6.2. CONSUMPTION SHARE BY SENSOR TYPE, BILLION UNITS, 2018 - 2025
6.3. PRODUCTION SHARE BY SENSOR TYPE, BILLION UNITS, 2018 – 2025
6.4. ULTRASONIC
6.4.1. Market determinants and trend analysis
6.4.2. Market revenue, sales and production volume, 2018 – 2025
6.5. PNEUMATIC
6.5.1. Market determinants and trend analysis
6.5.2. Market revenue, sales and production volume, 2018 – 2025
6.6. VIBRATING POINT
6.6.1. Market determinants and trend analysis
6.6.2. Market revenue, sales and production volume, 2018 – 2025
CHAPTER 7. GLOBAL LEVEL SENSOR MARKET BY TECHNOLOGY
7.1. SEGMENT OUTLINE
7.2. REVENUE SHARE BY TECHNOLOGY, $BILLION, 2018 – 2025
7.2. CONSUMPTION SHARE BY TECHNOLOGY, BILLION UNITS, 2018 - 2025
7.3. PRODUCTION SHARE BY TECHNOLOGY, BILLION UNITS, 2018 – 2025
7.4. NON-CONTACT TYPE
7.4.1. Market determinants and trend analysis
7.4.2. Market revenue, sales and production volume, 2018 – 2025
7.5.CONTACT TYPE
7.5.1. Market determinants and trend analysis
7.5.2. Market revenue, sales and production volume, 2018 – 2025
CHAPTER 8. GLOBAL LEVEL SENSOR MARKET BY APPLICATION
8.1. SEGMENT OUTLINE
8.2. REVENUE SHARE BY APPLICATION, $BILLION, 2018 – 2025
8.2. CONSUMPTION SHARE BY APPLICATION, BILLION UNITS, 2018 - 2025
8.3. PRODUCTION SHARE BY APPLICATION, BILLION UNITS, 2018 – 2025
8.4. CONTINUOUS LEVEL
8.4.1. Market determinants and trend analysis
8.4.2. Market revenue, sales and production volume, 2018 – 2025
8.5. POINT LEVEL
8.5.1. Market determinants and trend analysis
8.5.2. Market revenue, sales and production volume, 2018 – 2025
8.6. INTERFACE LEVEL
8.6.1. Market determinants and trend analysis
8.6.2. Market revenue, sales and production volume, 2018 – 2025
CHAPTER 9. GLOBAL LEVEL SENSOR MARKET BY INDUSTRY VERTICAL
9.1. SEGMENT OUTLINE
9.2. REVENUE SHARE BY INDUSTRY VERTICAL, $BILLION, 2018 – 2025
9.2. CONSUMPTION SHARE BY INDUSTRY VERTICAL, BILLION UNITS, 2018 - 2025
9.3. PRODUCTION SHARE BY INDUSTRY VERTICAL, BILLION UNITS, 2018 – 2025
9.4. FOOD AND BEVERAGE PROCESSING
9.4.1. Market determinants and trend analysis
9.4.2. Market revenue, sales and production volume, 2018 – 2025
9.5. CHEMICAL
9.5.1. Market determinants and trend analysis
9.5.2. Market revenue, sales and production volume, 2018 – 2025
9.6. OIL AND GAS
9.6.1. Market determinants and trend analysis
9.6.2. Market revenue, sales and production volume, 2018 – 2025
9.7.WATER AND WASTEWATER TREATMENT
9.7.1. Market determinants and trend analysis
9.7.2. Market revenue, sales and production volume, 2018 – 2025
9.8. PHARMACEUTICAL
9.8.1. Market determinants and trend analysis
9.8.2. Market revenue, sales and production volume, 2018 – 2025
CHAPTER 10. GLOBAL LEVEL SENSOR MARKET BY REGIONS
10.1. REGIONAL OUTLOOK
10.2. MARKET PRODUCTION, CONSUMPTION & REVENUE BY REGION, 2018-2025
10.3. NORTH AMERICA
10.3.1. Current Trends and Future Prospects
10.3.2. North America market revenue, sales and production volume, 2018 – 2025
10.3.3.U.S.
10.3.3.1. Level Sensor Market Revenue $BILLION (2018 – 2025)
10.3.3.2. Level Sensor Market Consumption BILLION Units (2018 – 2025)
10.3.3.3. Level Sensor Market Production BILLION Units (2018 – 2025)
10.3.4. Canada
10.3.4.1. Level Sensor Market Revenue $BILLION (2018 – 2025)
10.3.4.2. Level Sensor Market Consumption BILLION Units (2018 – 2025)
10.3.4.3. Level Sensor Market Production BILLION Units (2018 – 2025)
10.3.5. Mexico
10.3.5.1. Level Sensor Market Revenue $BILLION (2018 – 2025)
10.3.5.2. Level Sensor Market Consumption BILLION Units (2018 – 2025)
10.3.5.3. Level Sensor Market Production BILLION Units (2018 – 2025)
10.4. EUROPE
10.4.1. Current Trends and Future Prospects
10.4.2. Europe market revenue, sales and production volume, 2018 – 2025
10.4.3. U.K
10.4.3.1. Level Sensor Market Revenue $BILLION (2018 – 2025)
10.4.3.2. Level Sensor Market Consumption BILLION Units (2018 – 2025)
10.4.3.3. Level Sensor Market Production BILLION Units (2018 – 2025)
10.4.4. Germany
10.4.4.1. Level Sensor Market Revenue $BILLION (2018 – 2025)
10.4.4.2. Level Sensor Market Consumption BILLION Units (2018 – 2025)
10.4.4.3. Level Sensor Market Production BILLION Units (2018 – 2025)
10.4.5. France
10.4.5.1. Level Sensor Market Revenue $BILLION (2018 – 2025)
10.4.5.2. Level Sensor Market Consumption BILLION Units (2018 – 2025)
10.4.5.3. Level Sensor Market Production BILLION Units (2018 – 2025)
10.4.6. Italy
10.4.6.1. Level Sensor Market Revenue $BILLION (2018 – 2025)
10.4.6.2. Level Sensor Market Consumption BILLION Units (2018 – 2025)
10.4.6.3. Level Sensor Market Production BILLION Units (2018 – 2025)
10.4.7. Rest of Europe
10.4.7.1. Level Sensor Market Revenue $BILLION (2018 – 2025)
10.4.7.2. Level Sensor Market Consumption BILLION Units (2018 – 2025)
10.4.7.3. Level Sensor Market Production BILLION Units (2018 – 2025)
10.5. ASIA PACIFIC
10.5.1. Current Trends and Future Prospects
10.5.2. Europe market revenue, sales and production volume, 2018 – 2025
10.5.3. India
10.5.3.1. Level Sensor Market Revenue $BILLION (2018 – 2025)
10.5.3.2. Level Sensor Market Consumption BILLION Units (2018 – 2025)
10.5.3.3. Level Sensor Market Production BILLION Units (2018 – 2025)
10.5.4. Japan
10.5.4.1. Level Sensor Market Revenue $BILLION (2018 – 2025)
10.5.4.2. Level Sensor Market Consumption BILLION Units (2018 – 2025)
10.5.4.3. Level Sensor Market Production BILLION Units (2018 – 2025)
10.5.5. China
10.5.5.1. Level Sensor Market Revenue $BILLION (2018 – 2025)
10.5.5.2. Level Sensor Market Consumption BILLION Units (2018 – 2025)
10.5.5.3. Level Sensor Market Production BILLION Units (2018 – 2025)
10.5.6. South Korea
10.5.6.1. Level Sensor Market Revenue $BILLION (2018 – 2025)
10.5.6.2. Level Sensor Market Consumption BILLION Units (2018 – 2025)
10.5.6.3. Level Sensor Market Production BILLION Units (2018 – 2025)
10.5.7. Rest of APAC
10.5.7.1. Level Sensor Market Revenue $BILLION (2018 – 2025)
10.5.7.2. Level Sensor Market Consumption BILLION Units (2018 – 2025)
10.5.7.3. Level Sensor Market Production BILLION Units (2018 – 2025)
10.6. REST OF THE WORLD
10.6.1. Current Trends and Future Prospects
10.6.2. Europe market revenue, sales and production volume, 2018 – 2025
10.6.3. Latin America
10.6.3.1. Level Sensor Market Revenue $BILLION (2018 – 2025)
10.6.3.2. Level Sensor Market Consumption BILLION Units (2018 – 2025)
10.6.3.3. Level Sensor Market Production BILLION Units (2018 – 2025)
10.6.4. Middle East
10.6.4.1. Level Sensor Market Revenue $BILLION (2018 – 2025)
10.6.4.2. Level Sensor Market Consumption BILLION Units (2018 – 2025)
10.6.4.3. Level Sensor Market Production BILLION Units (2018 – 2025)
10.6.5. Africa
10.6.5.1. Level Sensor Market Revenue $BILLION (2018 – 2025)
10.6.5.2. Level Sensor Market Consumption BILLION Units (2018 – 2025)
10.6.5.3. Level Sensor Market Production BILLION Units (2018 – 2025)
CHAPTER 11. KEY VENDOR PROFILES
11.1. SICK AG
11.1.1. Company overview
11.1.2. Portfolio Analysis
11.1.3. Estimated revenue from level sensor business and market share
11.1.4. Regional & business segment Revenue Analysis
11.2. Emerson Electric company
11.2.1. Company overview
11.2.2. Portfolio Analysis
11.2.3. Estimated revenue from level sensor business and market share
11.2.4. Regional & business segment Revenue Analysis
11.3. AMETEK Incorporated
11.3.1. Company overview
11.3.2. Portfolio Analysis
11.3.3. Estimated revenue from level sensor business and market share
11.3.4. Regional & business segment Revenue Analysis
11.4. Texas Instruments Incorporated
11.4.1. Company overview
11.4.2. Portfolio Analysis
11.4.3. Estimated revenue from level sensor business and market share
11.4.4. Regional & business segment Revenue Analysis
11.5. TE Connectivity Limited
11.5.1. Company overview
11.5.2. Portfolio Analysis
11.5.3. Estimated revenue from level sensor business and market share
11.5.4. Regional & business segment Revenue Analysis
11.6. Pepperl+Fuchs GmbH
11.6.1. Company overview
11.6.2. Portfolio Analysis
11.6.3. Estimated revenue from level sensor business and market share
11.6.4. Regional & business segment Revenue Analysis
11.7. Nohken Incorporated
11.7.1. Company overview
11.7.2. Portfolio Analysis
11.7.3. Estimated revenue from level sensor business and market share
11.7.4. Regional & business segment Revenue Analysis
11.8. Endress+Hauser AG
11.8.1. Company overview
11.8.2. Portfolio Analysis
11.8.3. Estimated revenue from level sensor business and market share
11.8.4. Regional & business segment Revenue Analysis
11.9. First Sensor AG
11.9.1. Company overview
11.9.2. Portfolio Analysis
11.9.3. Estimated revenue from level sensor business and market share
11.9.4. Regional & business segment Revenue Analysis
11.10.Fortive Corporation
11.10.1. Company overview
11.10.2. Portfolio Analysis
11.10.3. Estimated revenue from level sensor business and market share
11.10.4. Regional & business segment Revenue Analysis
11.11. Krohne Messtechnik GmbH
11.11.1. Company overview
11.11.2. Portfolio Analysis
11.11.3. Estimated revenue from level sensor business and market share
11.11.4. Regional & business segment Revenue Analysis
11.12. ABB Limited
11.12.1. Company overview
11.12.2. Portfolio Analysis
11.12.3. Estimated revenue from level sensor business and market share
11.12.4. Regional & business segment Revenue Analysis
11.13. Siemens AG
11.13.1. Company overview
11.13.2. Portfolio Analysis
11.13.3. Estimated revenue from level sensor business and market share
11.13.4. Regional & business segment Revenue Analysis
PURCHASE OPTIONS
20% Free Customization ON ALL PURCHASE
*Terms & Conditions Apply
Looking for report on this market in a particular region or country? Get In Touch
Request Free Sample
Please fill in the form below to Request for free Sample Report
-
Office Hours Mon - Sat 10:00 - 16:00
-
Call Us +91 6201075429
-
Send Us Mail sales@marketdecipher.com
Market Decipher is a market research and consultancy firm involved in provision of market reports to organisations of varied sizes; small, large and medium.

© 2018 Market Decipher. All Rights Reserved